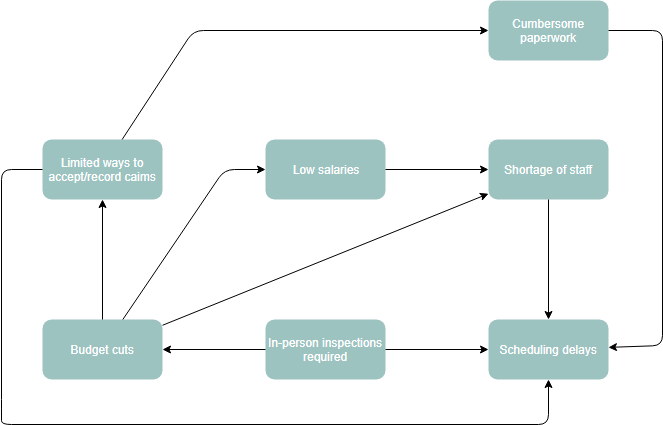
An interrelationship diagram is defined as a new management planning tool that depicts the relationship among factors in a complex situation. The interrelationship diagram shows cause-and-effect relationships. Its main purpose is to help identify relationships that are not easily recognizable.
An interrelationship diagram borders on being a tool for root cause identification, but it is mainly used to identify logical relationships in a complex and confusing problem situation. In such cases, the strength of an interrelationship diagram is its ability to visualize such relationships. The process of creating an interrelationship diagram can help groups analyze the natural links between different aspects of a complex situation.
When to Use an Interrelationship Diagram?
- Encourages team members to think in multiple directions rather than linearly
- Explores the cause and effect relationships among all the issues, including the most controversial
- Allows key issues to emerge naturally rather than to be forced by a dominant or powerful team member
- Systematically surfaces the basic assumptions and reasons for disagreements among team members
- Allows a team to identify the root cause(s) even when credible data does not exist
Steps for Creating Interrelationship Diagram
Constructing an interrelationship diagram helps participants isolate each dimension of a problem individually without it being a strictly linear process. Focusing on the individual dimension allows participants to concentrate on and analyze manageable pieces of a situation. When the analysis is complete, the diagram sheds considerable light on the problem, but only after the entire diagram has been assembled. Here are the steps for creating interrelationship diagrams: (*Source – PMI’s Business Analysis Guide)
- Identify the potential causes and effects, up to a maximum of ten to be practical.
- Draw lines between the effects and their causes. The arrows represent the direction of the cause. The arrow starts from the cause factor and points to the effect. See the Diagram example below and note the factor “budget cuts” and the causing factor “shortage of staff.”
- When two factors influence each other, understand which of the two is stronger and note which one.
- Interrelationship diagrams are most effective when arrows are limited in one direction, namely the stronger influence.
- Factors with the largest numbers of “incoming” arrows are those that are key outcomes of other factors, that is, effects. These often provide good measures of success or can be good items to quantify and monitor. In the Diagram below “scheduling delays” is shown to be the most significant effect.
- Factors that have a large number of “outgoing” arrows are the sources of the problem, that is, causes. Label the factor numbers in and out. In the Diagram below “budget cuts” is shown to be the most significant cause. Consider prioritizing needs assessments to address the strongest causes first.
- The significant cause and effect factors can be depicted in bold to emphasize them as in the example below:
