Complaint handling flowchart
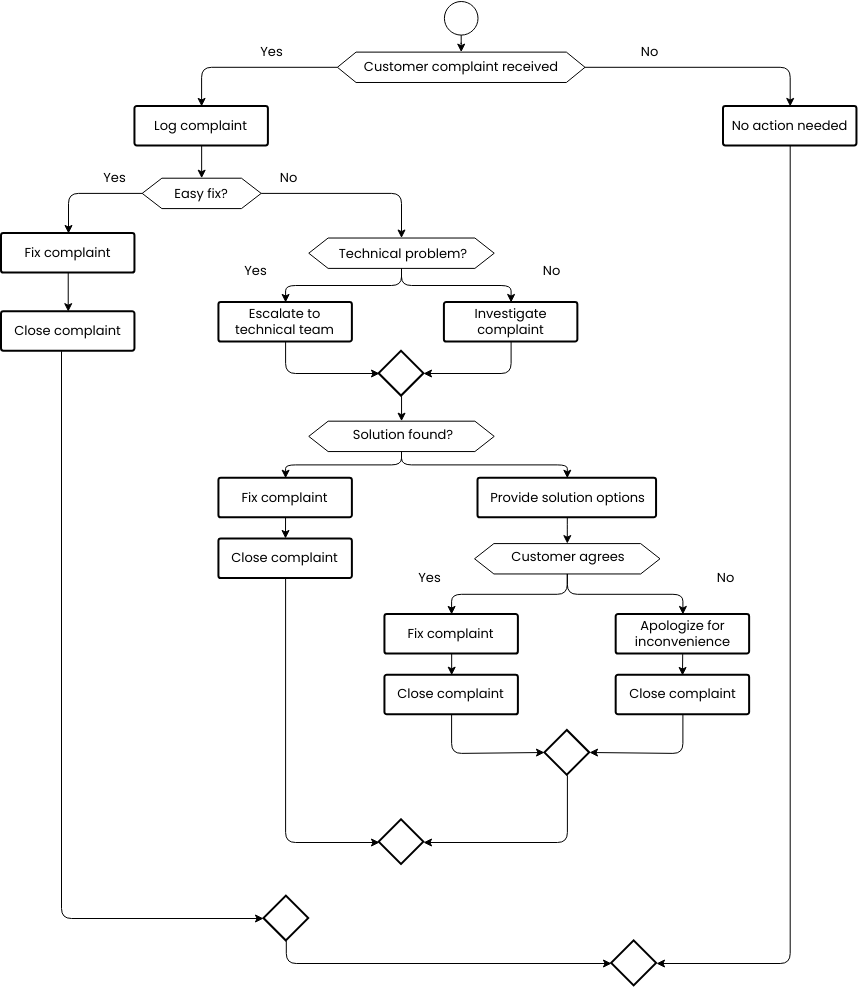
The Complaint handling flowchart outlines the process of handling customer complaints. The first step in the process is to log the complaint. This involves recording the details of the customer's complaint, such as the nature of the issue and any relevant details about the customer or the product or service in question. This step is critical in ensuring that all complaints are properly tracked and addressed.
Once the complaint is logged, it is then escalated to the technical team. This team is responsible for investigating the issue further, diagnosing the problem, and providing potential solutions. This step is crucial in ensuring that the root cause of the complaint is identified and addressed.
After the technical team has investigated the issue, they will provide solution options to the customer. These options may include fixing the issue, providing a replacement product or service, or offering a refund. This step is essential in ensuring that the customer is satisfied with the resolution of their complaint.
Once a solution has been agreed upon, the staff will apologize for any inconvenience caused to the customer. This step is critical in demonstrating empathy and acknowledging the customer's frustration or disappointment.
Finally, once the complaint has been resolved to the customer's satisfaction, it is closed. This involves updating the complaint log to reflect the resolution and any actions taken, as well as communicating the resolution to the customer.
In conclusion, the Complaint handling flowchart outlines the critical steps involved in handling customer complaints. By following this flowchart, organizations can ensure that customer complaints are properly tracked, investigated, and resolved in a timely and satisfactory manner. This can lead to increased customer satisfaction, improved customer loyalty, and a more successful business overall.
Benefits of creating this flowchart
Creating a flowchart for any process can bring several benefits for organizations. The first benefit is improved organization and clarity. A flowchart provides a clear and organized visual representation of a process. By mapping out each step in the process, a flowchart can help ensure that the process is well-organized and easy to understand. This can make it easier for staff members to follow the process and reduce the likelihood of errors or misunderstandings.
Another benefit of creating a flowchart is improved efficiency. A flowchart can help streamline a process by identifying areas where it can be simplified or made more efficient. By analyzing the flowchart, organizations can identify bottlenecks, redundancies, and other areas where the process can be improved. This can lead to a more efficient process that takes less time and reduces costs.
Consistency is another benefit of creating a flowchart. A flowchart can help ensure that a process is performed consistently, regardless of who is performing it. By following a defined process, staff members can ensure that each step is performed the same way every time, reducing errors and minimizing variability. This can also help ensure that the end result of the process is consistent and of high quality.
Improved communication is also a benefit of creating a flowchart. A flowchart can help improve communication between staff members by providing a shared understanding of the process. By having a visual representation of the process, staff members can communicate more effectively, reducing errors and misunderstandings. This can lead to a more efficient process with fewer delays or mistakes.
Finally, creating a flowchart can help organizations identify areas for continuous improvement. By analyzing the flowchart, organizations can identify areas for improvement in the process. This can lead to ongoing improvements to the process, resulting in even greater efficiency and effectiveness over time. This can also help organizations stay ahead of the competition by continually improving their processes to meet changing customer needs and market demands.


