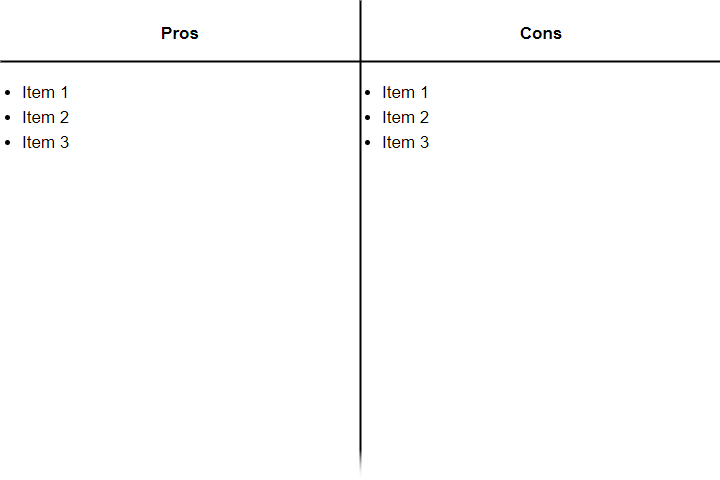
T-Chart is a graphic organizer that examines two facets of a topic, like the pros and cons associated with it, its advantages and disadvantages, facts vs. opinions, etc. By listing the topics as headings for the 2 columns, and writing down several facets that are valid for both options, it’s easy to make a comparison. In one form, it can be a list of positive and negative attributes surrounding a particular choice that ensures that both the positive and negative aspects of each direction or decision will be taken into account. Once you complete the overview, you will see you can come up with a solution to your problem. And this is important to make the final decision.
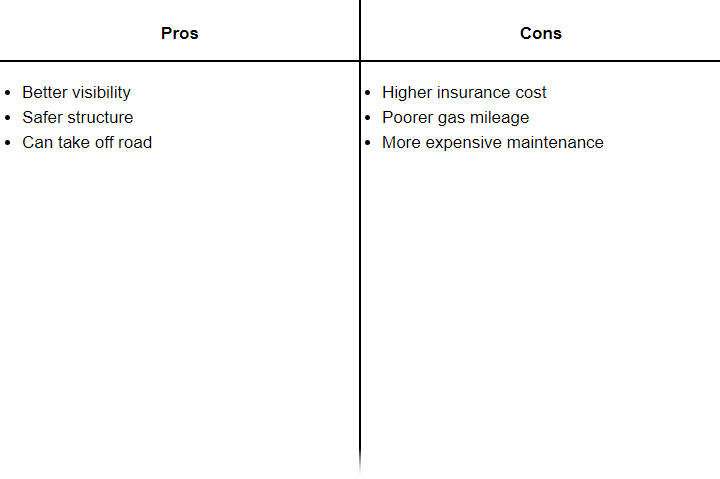
Example: what are the pros and cons of deciding to buy a sport utility vehicle?
When to Use T-Chart?
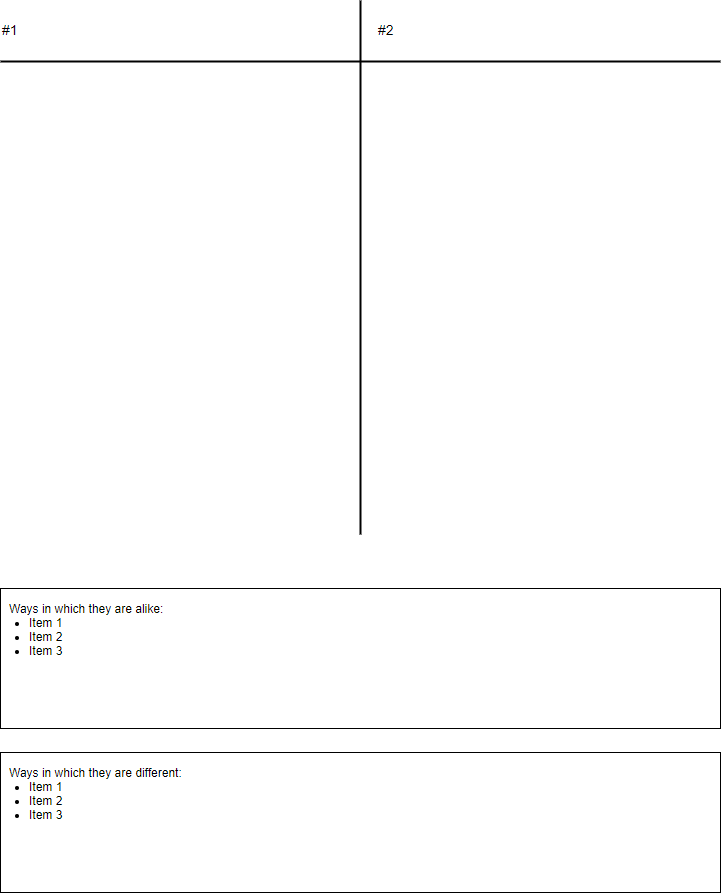
For example, a student can use a T-chart to help graphically organize thoughts about:
- Record information about any two characteristics of a topic
- Evaluating the pros and cons of a topic
- Making a decision by comparing the resulting advantages and disadvantages
- Listing facts vs. opinions of a theme
- Enumerating the problems and solutions associated with an action
- Explaining the strengths and weaknesses of a topic
T-Chart Templates
T Charts are easy and smart to use options for analyzing and comparing 2 options. There are several kinds of T-Chart templates in both portrait and landscape format. It is convenient to use such a T Chart template, because of the simplicity of the T Chart it provides you with an easy overview of all pros and cons of two different options.