A process map is a representation of this precise process definition, and the practice of process modeling is therefore fundamental to Six Sigma. Process mapping provides a powerful tool for displaying the steps, inputs and outputs, and other related details of a process by providing an “as-is” and step-by-step picture of the process.
A flowchart of a graphics technique for dissecting a process by capturing and integrating the combined knowledge of all persons associated with the process. We typically use a flowchart or OMG BPMN for performing process mapping during multiple phases of a Six Sigma project. Process mapping is a team effort and is documented by everyone who contributes to the process.
Process Mapping can help us to understand the following:
- Identifying steps of the process that add complexity and need to be simplified
- Visually comparing the current process to the potential new process
- Making it easier for those outside the project team to understand the process
What is a Flowchart?
A flowchart (also known as a process flow diagram) is a graphical tool that depicts distinct steps of a process in sequential order (from top to bottom of the page). The basic idea is to include all of the steps of critical importance to the process. Also, flowcharts are often annotated with performance information.
Use: The team would use a flowchart to visualize the process. Remember, much of what Six Sigma and Lean are all about is being able to visualize things that are otherwise not visible. A flowchart is a perfect example of being able to visualize the process.
The Elements of Flowchart
| Element | Symbol | Description |
| Start/ Stop |  |
The start and stop point in the process is denoted by this symbol and is often known as the terminator. |
| Process Step |  |
One of the most commonly used symbols in a process map, a process step that denotes a task or activity of the process. |
| Decision |  |
It denotes the points where decisions are needed in the process, or generally the phases where there are two options like yes/ no or pass/ fail. |
| Delays |  |
The delays in the process are denoted by symbol D.
|
| Flow Line Connectors |  |
The movement in the process is shown using the flow line connectors that shows the direction in which the process flows. |
| Storage |  |
The storage and filling variables are shown using an inverse triangle |
| On page connector |  |
To draw many flow lines crossing each other and making the process map messy, connectors are used to show that one point connects with another. Connectors provide an easy reference in the process map. |
| Off-page connector |  |
It serves as a connector to connect the process on the other page
|
| Sub-routine |  |
It represents a formally predefined process.
|
| Document |  |
It represents the process steps that produce a document |
| Data |  |
The data concerning the inputs and outputs are shown using this diagram.
|
| Manual Input |  |
This symbol indicates the need for the operator or user to manually feed the required information in the process. |
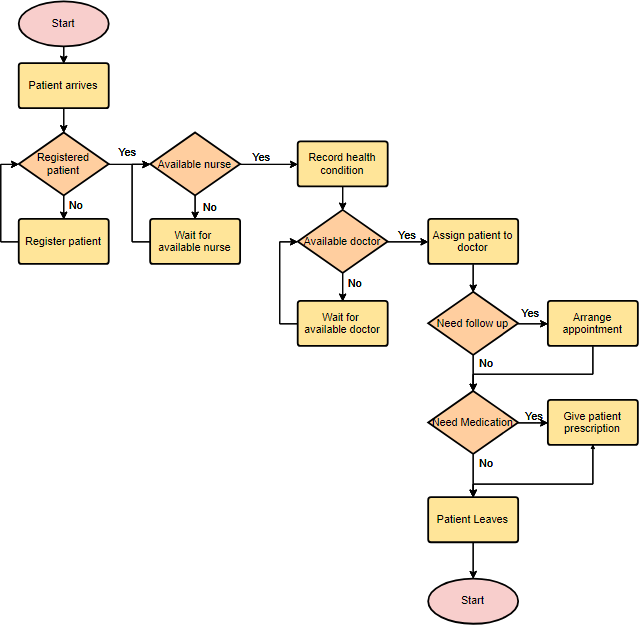
Pattern I: Simple Process – Medical Service
This is a hospital flowchart example that shows how clinical cases shall be processed. This flowchart uses decision shapes intensively in representing alternative flows.
The following flowchart is to model a simple product inspection process:
You can apply different colors coding or color legend for the specific meaning of the shapes in the flowchart.
Patterns II – Swimlane Flowchart
Swimlane flowchart (also known as a cross-functional flowchart, or deployment flowchart) is an effective visualization technique that lets each functional contributor to a process understand his role while giving everyone a chance to see just how complicated the process may be within your organization. Remember, each time you cross a lane, you have in essence created a supplier-customer interaction that implies needs, wants, and desires that must be met.
Why Swimlane Flowcharts?
Processes can be represented by flowcharts, but they have one drawback – a standard flowchart cannot indicate who is responsible for the activities. A cross-functional flowchart reveals who does what and when in swimlanes or grid-like diagram organized into sections that provide an extra dimension by assigning each process step to a category. In other words, you can use a cross-functional flowchart to portray the relationship between the steps in a process and the departments or functional areas that are responsible for those steps. For example, the category can be a stakeholder (person, role, or department), but it can also be a machine, a project phase, a resource, or some other attribute.
In a swimlane flowchart, time flows from left to right; the process crosses lanes as it traverses departments on its journey from start to finish. For example, you’re the customer in the process map: You’re in lane 1. As you work your way through customer service and then the banking services, you cross over into lanes 2, 3 and so. Here is a generic swimlane flowchart template:
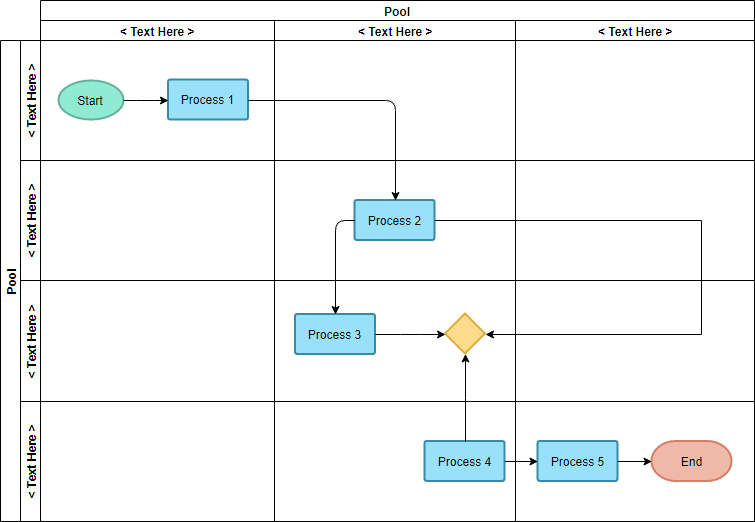
Edit this Swimlane Flowchart Template
Deployment Flowchart Template
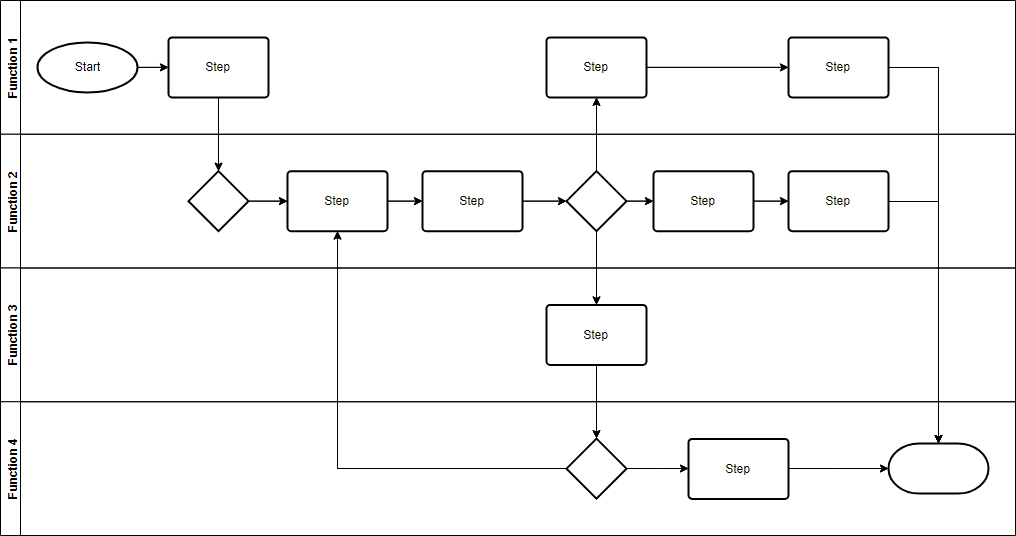
In Six Sigma, we use a deployment flowchart (also called Swimlane Flowchart) to find, understand, and correct sources of non-value-added waste in transactional or business processes. Creating a deployment flowchart, it becomes quite easy to quickly see handoffs, decision points, delays, loopbacks, and redundant process steps.
Edit this Deployment Flowchart Template
Cross-functional Flowchart Example – Newsletter Signup
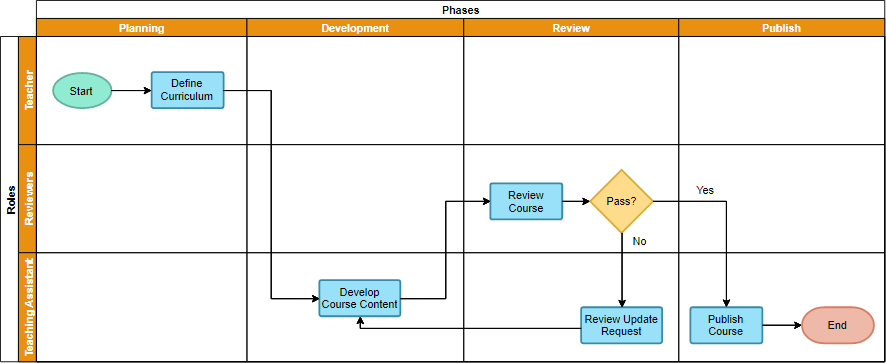
A Cross-functional flowchart models the entire process of course development as shown in the following example. The process is divided into 4 phases – Planning, Development, Review and Publish. The teacher, reviewers, and teaching assistant work together to produce a course.
Edit this Cross-Functional Flowchart Template
The cross-functional flowchart is a useful modeling technique for clarifying the responsibilities within the company. As shown in the example above, of differentiating who is responsible for which step along the working process, they are very useful for helping departments work together in better cooperation.
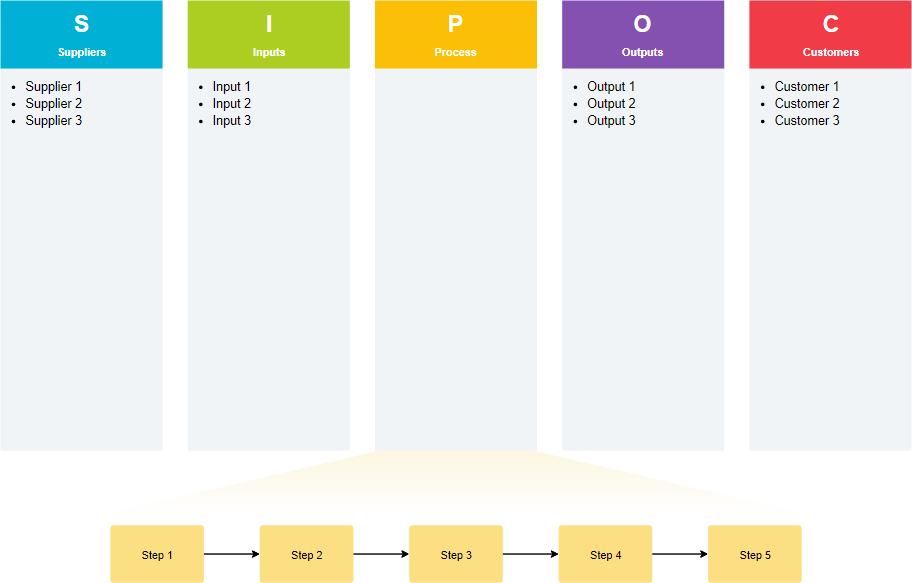
Pattern 3 – Elaborating SIPOC with Flowcharts
A most popular diagram in Six Sigma is referred to as a SIPOC, which stands for Suppliers, Inputs, Processes, Outputs, and Customers. SIPOCs are a great starting point for understanding a process at a high level, ensuring that important inputs, customers, etc., are accounted for.