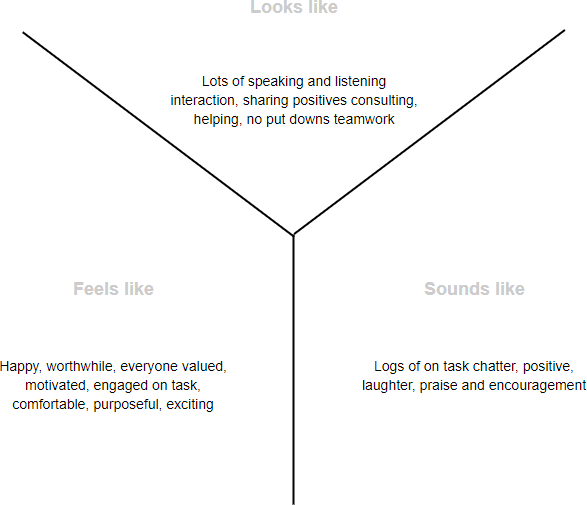
The Y Chart is a three-part graphic organizer that organizes the brainstorming of a topic around three dimensions:
- What does it look like?
- What does it feel like?
- What does it sound like?
Traditionally, teachers have been using the Y Chart as an effective tool in the classroom for many years. It serves as an analytical tool since students and teachers strive to discover more and more about a topic using the sensate approach of what does this topic Look, Sound and Feel like.
T-Chart is usually completed as a pre-product stage or a brainstorming exercise from which one can start creating a product such as a written report, bubble maps, Powerpoints, and interviews. This process encourages participants to be critical thinkers and identify appropriate behaviors for achieving this.
Steps for Creating a Y-Chart?
- Decide on the topic/social skill you wish to explore with your students
- Organize students into small groups, allocating tasks to each group member such as recorder, reporter, time-keeper, organizer
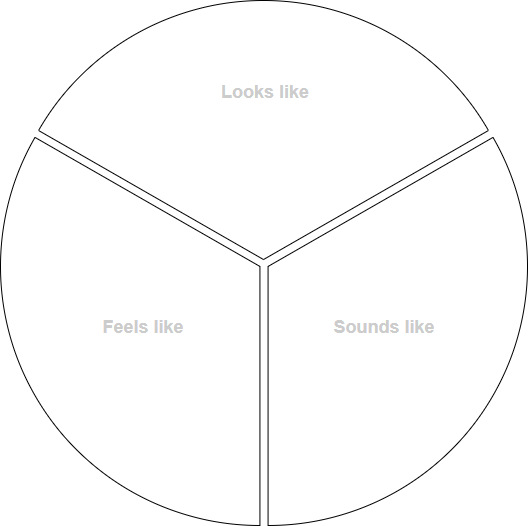
- Team members create a Y Chart with the heading Looks like, sounds like and feels like in each third of the chart
- Have the team brainstorm as many possibilities as they can within a specific time limit
- Each group reports back
Example – what does a team forming meeting look like, feel like, and sound like.