A data flow diagram (DFD) represents the flow of information through a system. DFDs quickly became a popular way to visualize the major steps and data involved in software-system processes. They were used to show data flow in a software system, although they could, in theory, be applied to business process modeling. DFDs were useful to document the major data flows or to explore a new high-level design in terms of data flow.
What is DFD?
A data-flow diagram (DFD) is a way of representing a flow of data of a process or a system (usually an information system), for example:
- Where data comes from
- Where it goes
- How it gets stored
In other words, it shows how data is processed by a system in terms of inputs and outputs. DFD is built using standardized symbols. There are several notations for displaying data-flow diagrams.
History of DFD
The DFD notation draws on graph theory, originally used in operational research to model workflow in organizations. DFD originated from the Activity Diagram used in the SADT (Structured Analysis and Design Technique) methodology at the end of the 1970s. DFD popularizers include Edward Yourdon, Larry Constantine, Tom DeMarco, Chris Gane, and Trish Sarson.
The Elements of a DFD
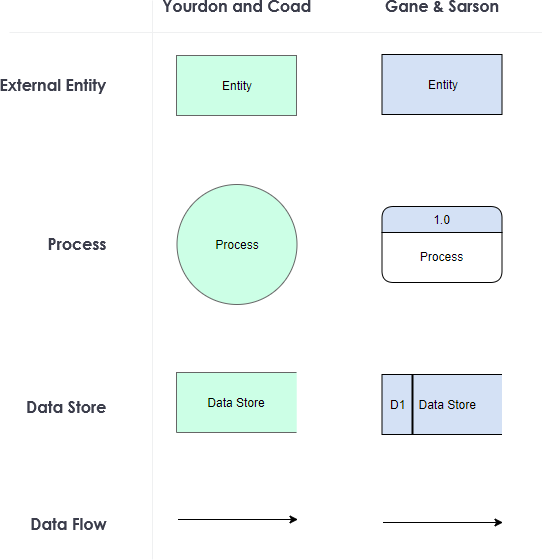
Different people use different notations to represent processes, data stores, data flow and external entities of the DFD. The most commonly used two different types of notations are by Yourdon & Coad or Gane & Sarson.
DFD uses 4 basic symbols to represent the flow of the diagram. They are
- Process
- Data Store
- External Entity
- Data Flow (Arrow)
Chris Gane & Trish Sarson Notation
The Gane &Sarson method stresses the identification of each node to help reference process narratives that further define each component either in plain text or pseudocode.
- A data store is represented as an open rectangle (3 sides, open on the right).
- Processes are represented by a rounded upright rectangle, subdivided into sections for a reference value, a process description, and an optional location specifier.
Yourdon and Coad / DeMarco Notation
Yourdon and Coad method includes components for creating data-flow diagrams and also object state diagrams. Some unique attributes of their DFD notation include:
- A data store is represented as two parallel, horizontal lines.
- Processes are represented by a circle
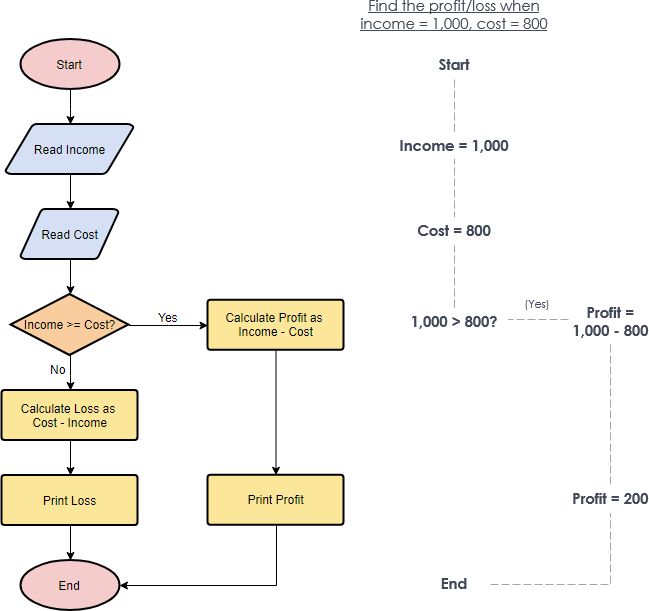
Flowchart vs DFD
Both Data Flow Diagrams (DFD) and Flowcharts are used to make it easier to understand the way a process is taking place or data is being processed.
A Data Flow Diagram shows how data flows through a system which is processed as well. The flow of the data from an external or internal source as well as where the data will end up is shown in a DFD. A DFD has no control flow, there are no decision rules and no loops. Specific operations based on the data can be represented by a flowchart.
Edit this Yourdon and Coad Example
A flowchart is used to break down a complex process into simple steps (denoted by different boxes) that are connected by arrows. It starts at the beginning of the process and follows each step through the process until the end. Flowcharts can also show how to deal with problems that may occur during the process.
Top-Down Decomposition Technique in DFD
In DFD, the top-down decomposition, also called leveling, is a technique used to show more detail in lower-level DFDs. Leveling is done by drawing a series of increasingly detailed diagrams until the desired degree of detail is reached. As shown in the Figure, DFD Leveling is first displaying the targeted system as a single process, and then showing more detail until all processes are functional primitives.
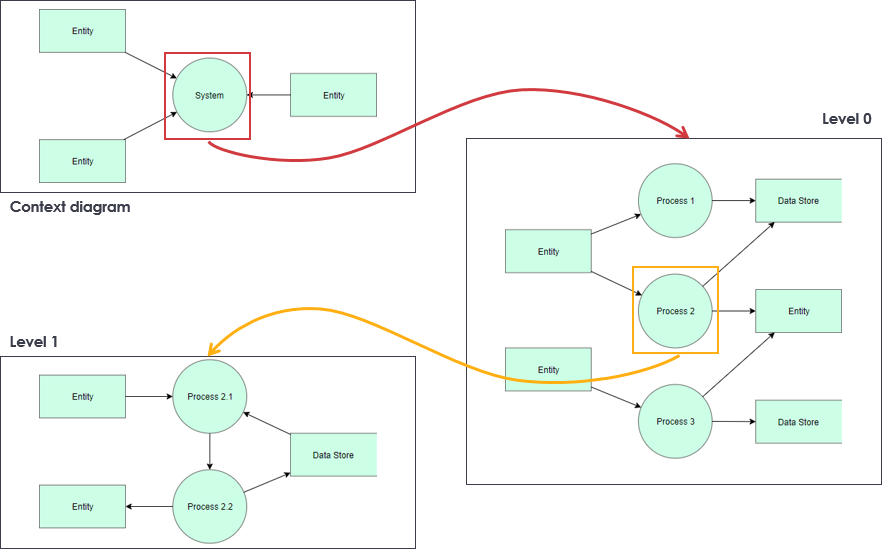
- DFDs that are at a higher level are less detailed
- High-level DFDs are to be decomposed into more detailed DFDs at lower levels
- The Context Diagram is the highest in the hierarchy (see DFD Creation Rules). The so-called zero level is followed by DFD 0, starting with process numbering (e.g., process 1, process 2).
- In the next, the so-called first level – DFD 1 – the numbering continues. E.g. process 1 is divided into the first three levels of the DFD, which are numbered 1.1, 1.2 and 1.3.
- Similarly, processes in the second level (DFD 2) are numbered e.g. 1.1.1, 1.1.2, 1.1.3 and 1.1.4.
- The number of levels depends on the size of the model system. Each of the processes in level 0 may not have the same number of decomposition levels.
DFD Examples – Customer Services System Example
The data flow diagram is a hierarchy of diagram consist of:
- Context Diagram (conceptually level zero)
- The Level-1 DFD
- And possible Level-2 DFD and further levels of functional decomposition depending on the complexity of your system
Context DFD
The figure below shows a context Data Flow Diagram that is drawn for a railway company’s Customer Service System. It contains a process (shape) that represents the system to model, in this case, the “CS System“. It also shows the participants who will interact with the system, called the external entities. In this example, the CS Assistant and Passenger are the two entities that will interact with the system. In between the process and the external entities, there is data flow (connectors) that indicate the existence of information exchange between the entities and the system.
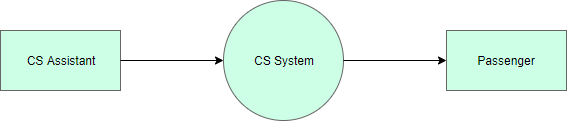
Edit this Yourdon and Coad DFD Example
Context DFD is the entrance of a data flow model. It contains one and only one process and does not show any data store.
Level 1 DFD
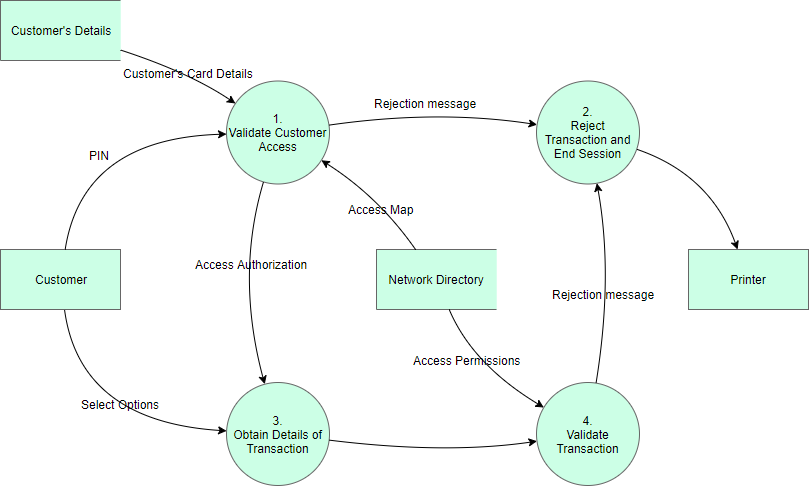
The figure below shows the level 1 DFD, which is the decomposition (i.e. break down) of the CS System process shown in the context DFD. Read through the diagram and then we will introduce some of the key concepts based on this diagram.
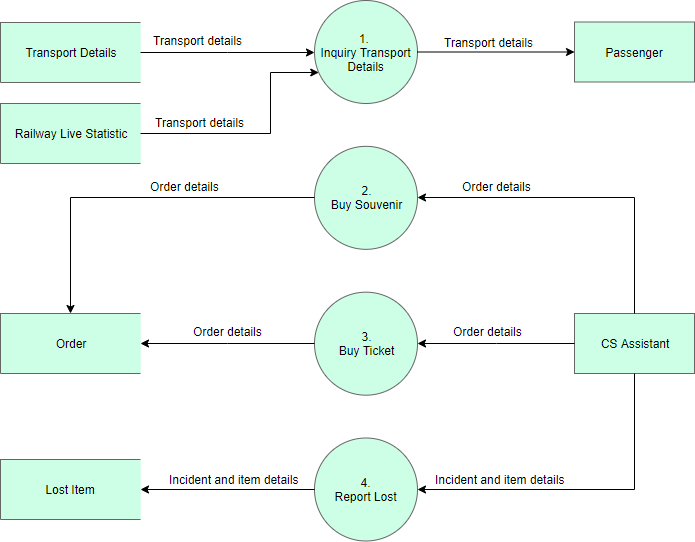
Edit this Yourdon and Coad Diagram Example
The CS System Data Flow Diagram example contains four processes, two external entities, and four data stores. Although there are no design guidelines that govern the positioning of shapes in a Data Flow Diagram, we tend to put the processes in the middle and data stores and external entities on the sides to make it easier to comprehend.
Based on the diagram, we know that a Passenger can receive Transport details from the Inquiry Transport Details process, and the details are provided by the data stores Transport Details and Railway Live Statistic. While data stored in Transport Details are persistent data (indicated by the label “D”), data stored in Railway Live Statistic are transient data that are held for a short time (indicated by the label “T”). A callout shape is used to list out the kind of details that can be inquired by a passenger.
CS Assistant can initiate the Buy Souvenir process, which will result in having the Order details stored in the Order data store. Although the customer is the real person who buys souvenirs, it is the CS Assistant who accesses the system for storing the order details. Therefore, we make the data flow from the CS Assistant to the Buy Souvenir process.
CS Assistant can also initiate the Buy Ticket process by providing Order details and the details will be stored again in the Order data store. Data Flow Diagram is a high-level diagram that is drawn with a high degree of abstraction. The data store Order which is drawn here does not necessarily imply a real order database or order table in a database. The way how order details are stored physically is to be decided later on when implementing the system.
Finally, CS Assistant can initiate the Report Lost process by providing the Incident and item details and the information will be stored in the Lost Item database.