Cause and effect is a relationship between events or things, where one is the result of the other or others. This is a combination of action and reaction. A cause-and-effect analysis generates and sorts hypotheses about possible causes of problems within a process by asking participants to list all of the possible causes and effects for the identified problem.
5 Whys
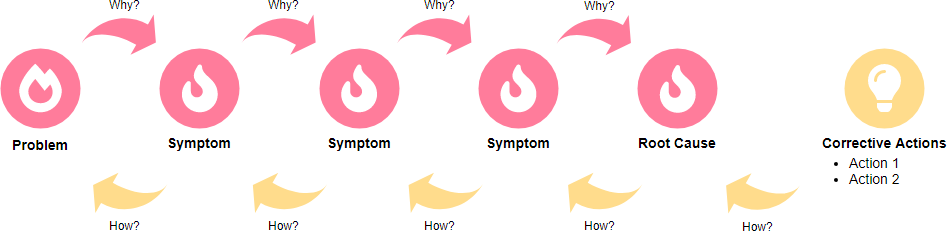
The 5 Whys is a simple tool used to help you understand what’s causing a problem by using an iterative interrogative technique to explore the root cause underlying a particular problem. As the name suggested, 5 Whys takes five iterations of asking “Why” to drill down from one symptom to another until you reached the root cause (Sometimes asking “Why?” five times is too many, and sometimes you need to ask it more than five times). Use the 5 Whys when you want a simple way to dig for a deeper understanding of the root cause of a problem, so you can better address it.
- It’s easy.
- It doesn’t require high-tech or complicated tools.
- It can be done relatively quickly.
- It can foster teamwork and a common understanding of a problem.
5 Whys Example – Machine Failure
A machine suddenly stopped, then follow this clue to follow a series of step-by-step pressing questions:
Q: “Why doesn’t the machine turn?”
Answer: “Because the fuse is broken.”
Q: “Why does the fuse break?”
Answer: “The current is too high due to overload.”
Q: “Why is it overloaded?”
Answer: “Because the bearings are not lubricious enough.”
Q: “Why are the bearings not lubricating enough? ”
Answer: “Because the oil pump cannot suck the lubricant. ”
Q: “Why can’t the oil pump suck up the lubricant? ”
Answer: “Because the oil pump will cause severe wear and tear. ”
Q: “Why does the oil pump cause severe wear? ”
Answer: “Iron dust was mixed in because the oil pump was not equipped with a filter. ”
After asking this, the water came out, and the final cause was found!
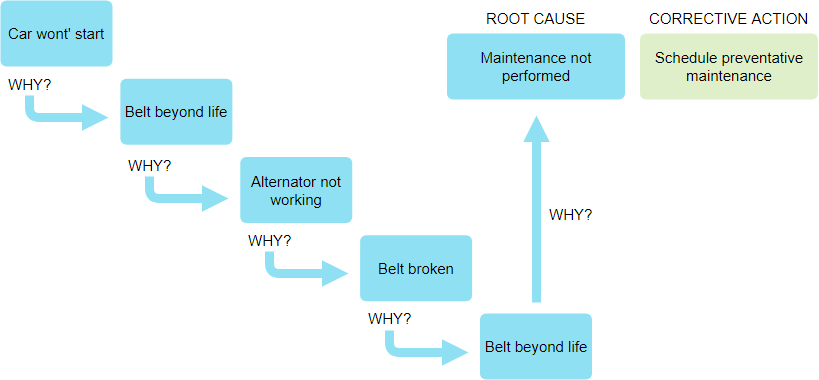
5 WHYS Root Cause Analysis Example – Car Won’t Start
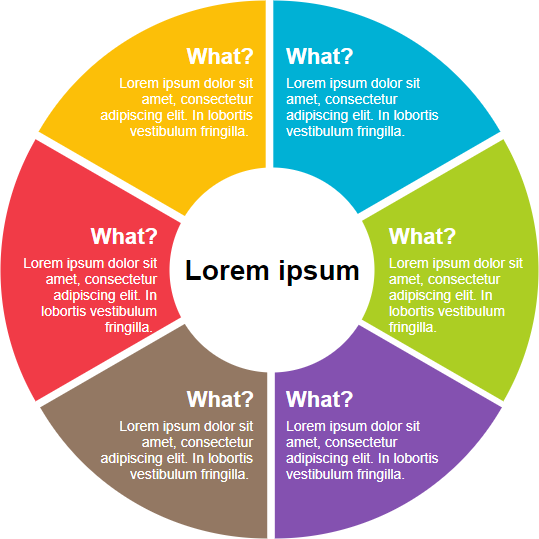
5W1H
The 5W1H analysis is a method of thinking that has been widely used in business management, daily work life, and learning. It was extended from the “5W analysis” proposed by American political scientist Harold Lasswell and was first used for the management of production projects in enterprises.
5W + 1H proposes Problem (What), reasons (Why), place (Where), time (When), personnel (Who), Method (how) to help thinking and analysis. Let’s first see how the 5W1H analysis method is used in enterprise production, and then I will give two examples related to personal development.
Problem (What)
- What products does the company produce?
- What spare parts are produced in the workshop?
- Why make this product?
- Can you produce anything else?
- What should I produce?
- For example: If this product does not make money, is it better to switch to other high-profit products?
Where (where)-what place
- Where is production done?
- Why do you want to do this location?
- Can you change places?
- Where should I do it?
This is something to consider when choosing a workplace.
Time and Process (when)
- When did the processor component produce?
- Why did you do it at this time?
- Can you do it at other times?
- Would it be okay to bring the post process to the front?
- When should I do it?
Person (Who) — responsible person
- Who is doing this?
- Why let him do it?
- If he is both irresponsible and has a strong temper, can he change individuals?
Sometimes changing people will improve their overall production.
Reason (why)
- Why use this technical parameter?
- Why can’t there be changes?
- Why can’t I use it?
- Why does it turn red?
- Why did you make this shape?
- Why use machines instead of humans?
- Why do we have to do it?
Method (how)
The means is also the process method, for example,
- How do we do it?
- Why use this method?
- Is there any other way to do it?
5W1H Mind Map Template
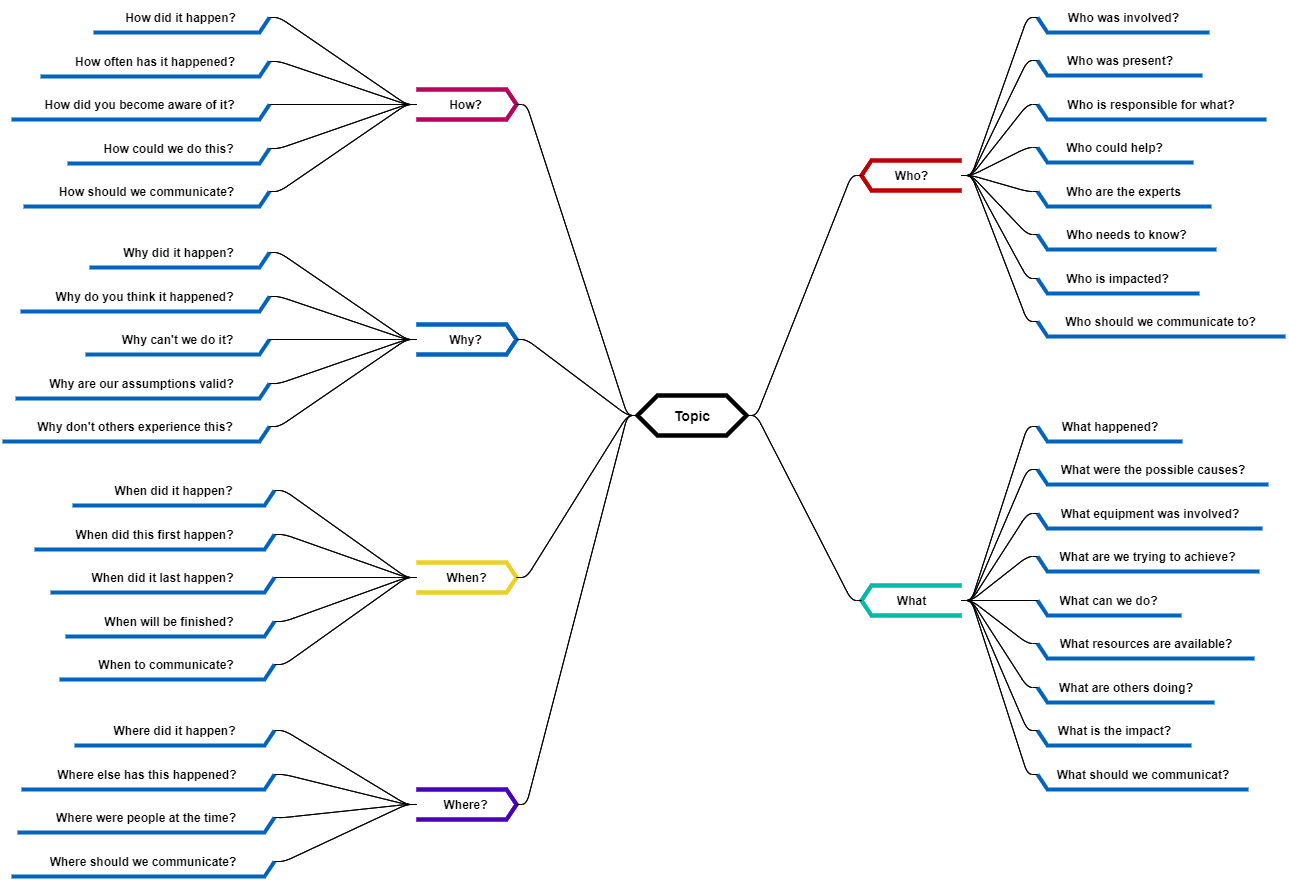
Edit this 5-Whys mind map template
5W1H Example – Software Project Failure
Let’s consider the software development project as a scenario where the agile team has found that technology they are using is not fully compatible with the existing systems of their client, so the agile team adopts the 5W1H to understand the problem and its identity of impact.
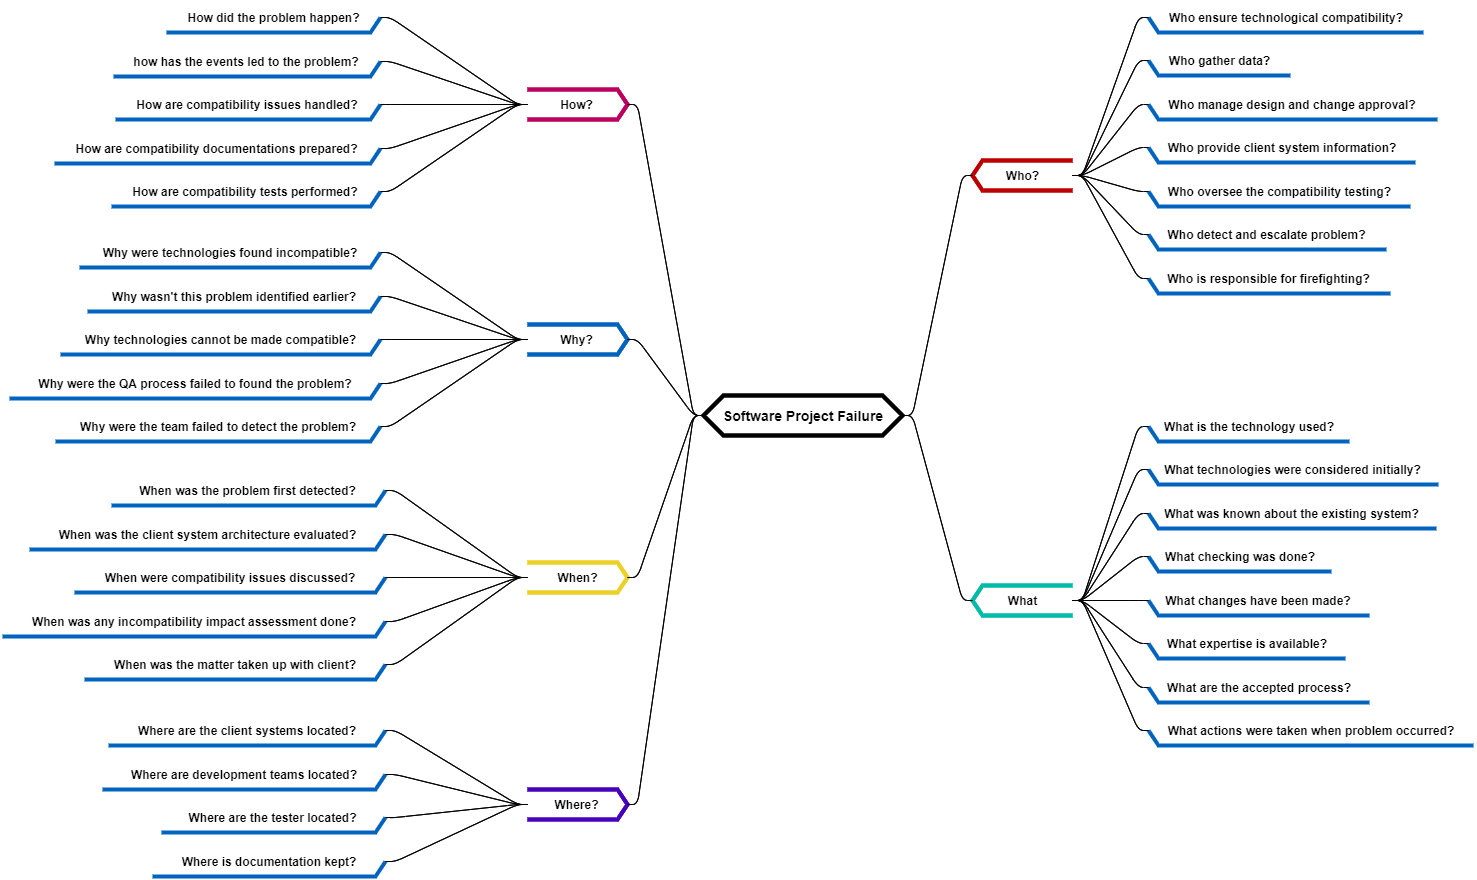
Edit this 5-Whys mind map example
- What: The team can ask the following questions to build an understanding of the fundamental problem and scope of the problem
- What is the technology we are using for software development?
- What technologies were considered initially for this development project?
- What was known about the existing system(s) of the client?
- What checks and verifications were done to confirm the compatibility of the technology being built and the deployment acceptability of new technology on the existing client system(s)?
- What (if any) approved or unapproved modifications/changes have been made following discussions on technological compatibility since the start of the project?
- What expertise is available to the team to help them understand the compatibility issue?
- What are the accepted processes for managing compatibility and technological synergies?
- What guidelines or standard operating procedures (SOPs) are available to deal with such issues?
- What actions were taken once the problem was detected?
- Why: The project team may ask ‘Why’ questions to get a more granular understanding of the problem and seek to clarify triggers or drivers that may have contributed to the issue. Some of the questions that can be asked are:
- Why has it happened that two technologies are now found to be incompatible?
- Why was this problem not identified earlier or at the start of the project?
- Why technologies cannot be made compatible?
- Why were quality assurance processes not able to detect the problem?
- Why were the project team or experts involved in the project not able to detect the problem?
- When: By using ‘When’ questions, project team members can time stamp the events and understand the relationships among various events that may have influenced the emergence of the incompatibility issue.
- When was the problem first detected?
- When was client system(s) information/architecture evaluated?
- When were compatibility issues mapped and discussed?
- When were any compatibility tests are done and compatibility found acceptable?
- When was any incompatibility impact assessment done?
- When was the matter taken up with the client or client informed?
- Where: By asking ‘Where’ questions, the project team can get a better handle of the source(s) of the problem. Some questions that can be asked:
- Where is the client system(s) located?
- Where are the development teams located?
- Where are quality assurance/testers located?
- Where is documentation on system compatibility kept?
- Where is any approval/change management documentation on system architecture and compatibility kept?
- Who: The project team can ask questions to identify the people involved in contributing to the issue. Some questions that may be asked:
- Who is responsible for ensuring technological compatibility within the project team?
- Who is responsible for data gathering and client system(s) mapping on the project team side?
- Who is responsible for the design and change management approvals?
- Who is responsible for providing client system(s) information and technical details to the project team from the client-side?
- Who is responsible for overseeing the compatibility testing and reporting?
- Who is responsible for problem detection and escalation?
- Who is responsible for problem firefighting and liaison?
- Who detected the problem or came to know the problem first and who were informed first?
- Who escalated the problem and informed the firefighting parties?
- How: To understand the sequence of various inter-related events, the project team can ask how questions such as:
- How did the problem happen?
- How has the sequence of events led to the detection of the problem?
- How are compatibility issues handled and key activities identified in the project?
- How is compatibility documentation prepared, shared and stored?
- How are compatibility tests performed?
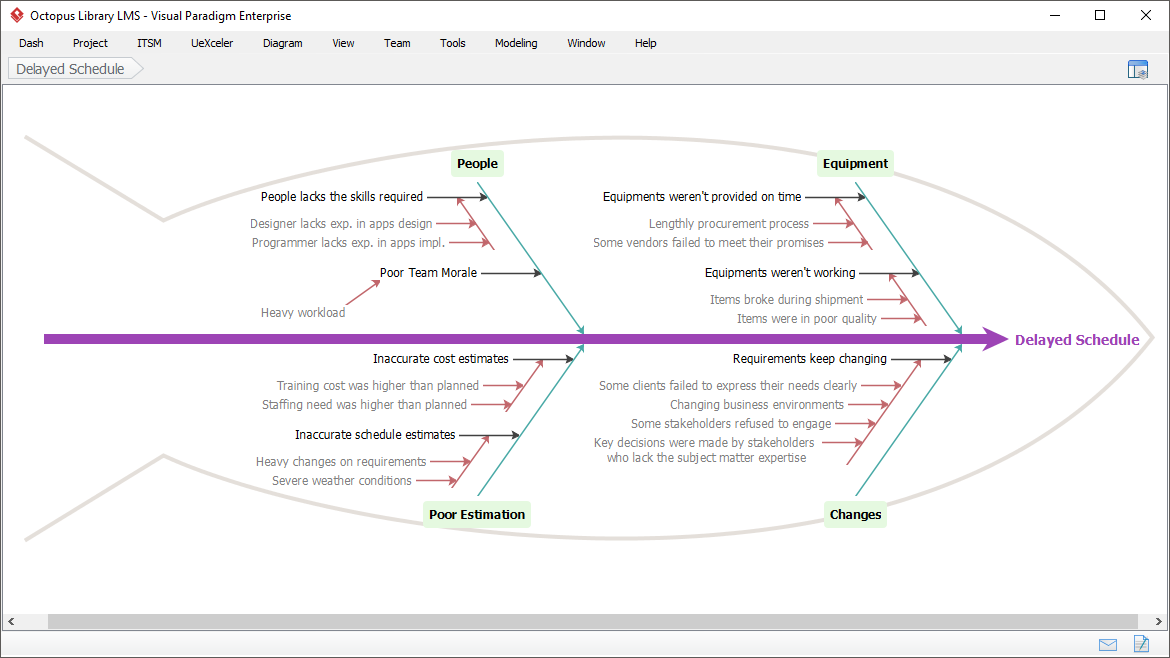
Fishbone
A Fishbone diagram is a kind of widely used Cause-and-Effect tool that helps identify, sort, and display possible causes of a specific problem or quality characteristic. It graphically illustrates the relationship between a given outcome and all the factors that influence the outcome. Fishbone diagram also called an “Ishikawa diagram” named after Kaoru Ishikawa who invented the diagram. It is called the “fishbone diagram” because of the way it looks.
Cause and effect analysis is often conducted by drawing cause-and-effect diagrams (also known as Fishbone Diagram), which organize a large amount of information by showing links between events and their potential or actual causes and provide a means of generating ideas about why the problem is occurring and possible effects of that cause.
It visually displays multiple causes for a problem and helps us to identify stakeholder ideas about the causes of problems which Allows us to immediately categorize ideas into themes for analysis or further data gathering. People often use the 5-whys technique in conjunction with the fishbone diagram.
Learn more about the cause and effect diagram tool
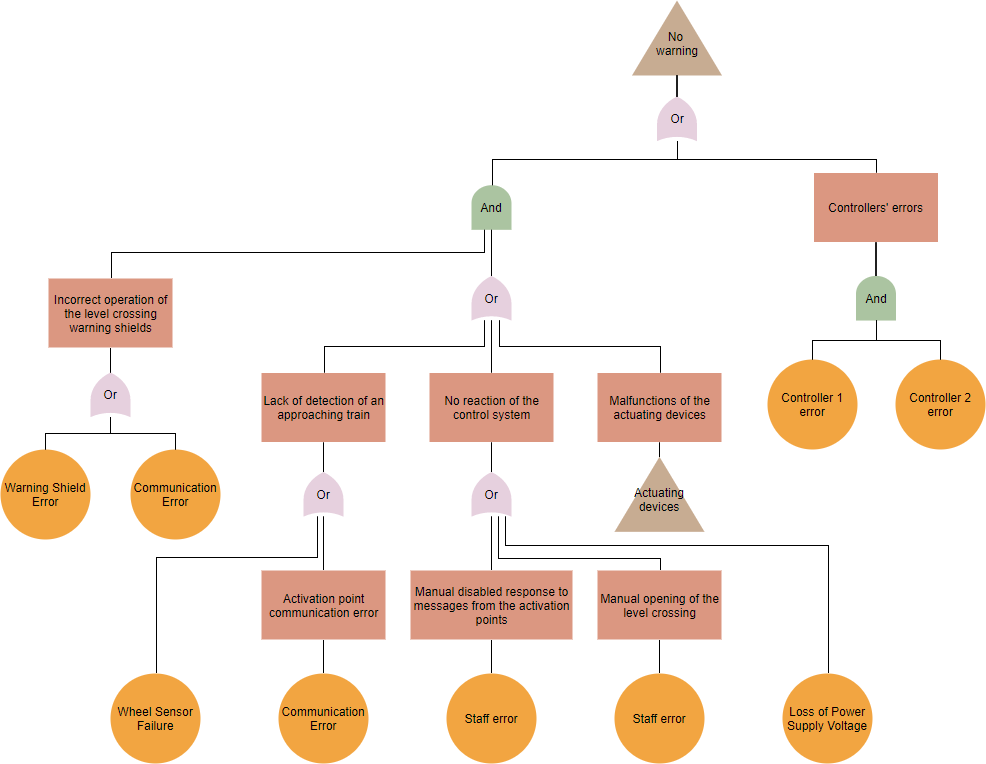
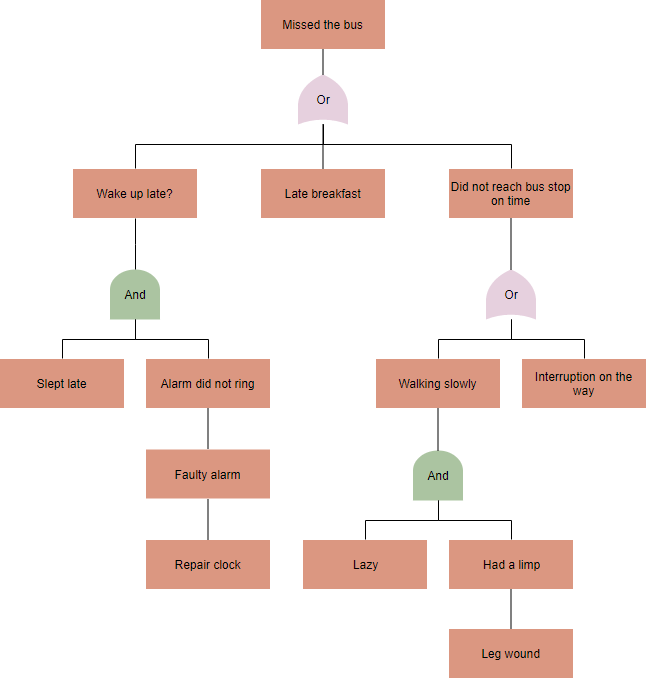
Fault Tree Diagram
Fault Tree Analysis (FTA) diagram is a top-down, deductive analysis method that shows a failure path or failure chain. FTA follows the concept of Boolean logic, which permits the creation of a series of statements based on True / False, forming a logic diagram that shows the cause of failure.
This analysis method is mainly used in the fields of safety engineering and reliability engineering to understand how systems can fail, to identify the best ways to reduce risk or to determine (or get a feeling for) event rates of a safety accident or a particular system level (functional) failure. FTA is also used in software engineering for debugging purposes and is closely related to the cause-elimination technique used to detect bugs. It can be used to:
- Understand the logic leading to the top event / undesired state.
- Show compliance with the (input) system safety/reliability requirements.
- prioritize the contributors leading to the top event- creating the critical equipment/parts/events lists for different importance measures
- Monitor and control the safety performance of the complex system (e.g., is a particular aircraft safe to fly when fuel valve x malfunctions? For how long is it allowed to fly with the valve malfunction?).
- Minimize and optimize resources.
- Assist in designing a system. The FTA can be used as a design tool that helps to create (output / lower level) requirements.
- Function as a diagnostic tool to identify and correct the causes of the top event. It can help with the creation of diagnostic manuals/processes.
Edit this Fault Tree Analysis example
Failure Mode and Effects Analysis (FMEA)
FMEA (failure mode and effects analysis) is a procedural approach for knowledge collection regarding points of failure in a product, service, design, or manufacturing process. FMEA can benefit your business include a reduction in potential failures and savings of lives and excessive costs. Organizations are wise to use this strategy to prevent catastrophes and save valuable resources.
The failure mode is a precaution of anything that may have a chance of breaking down. This includes potential errors or errors that may affect customers. It will also identify and gain a better understanding of the potential failure modes and their causes. This allows the team to prioritize issues and evaluate risks then coming up with a solution.
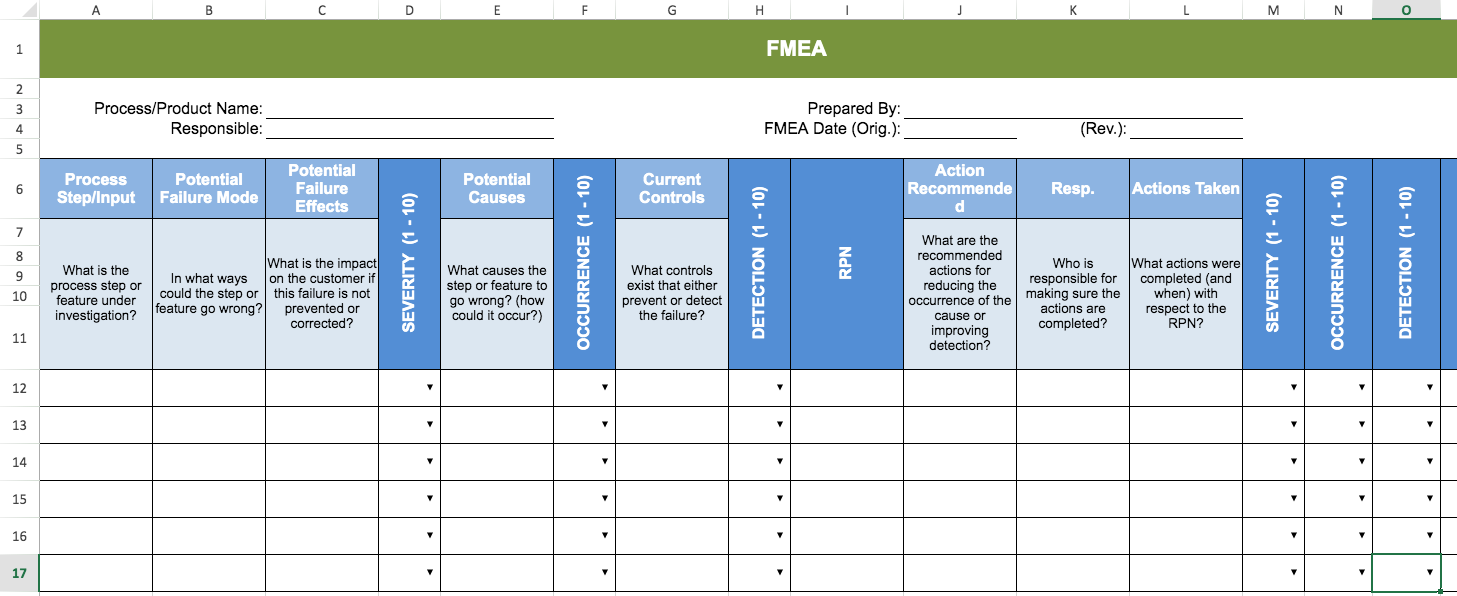
- You may need to consider the following questions:
- What could go wrong?
- Why would failure happen?
- What would be the consequences of each failure?
- Once failure modes are completed the team can continue with Effects Analysis. This is when they can study the consequences of those failures.
Tree Diagram Template
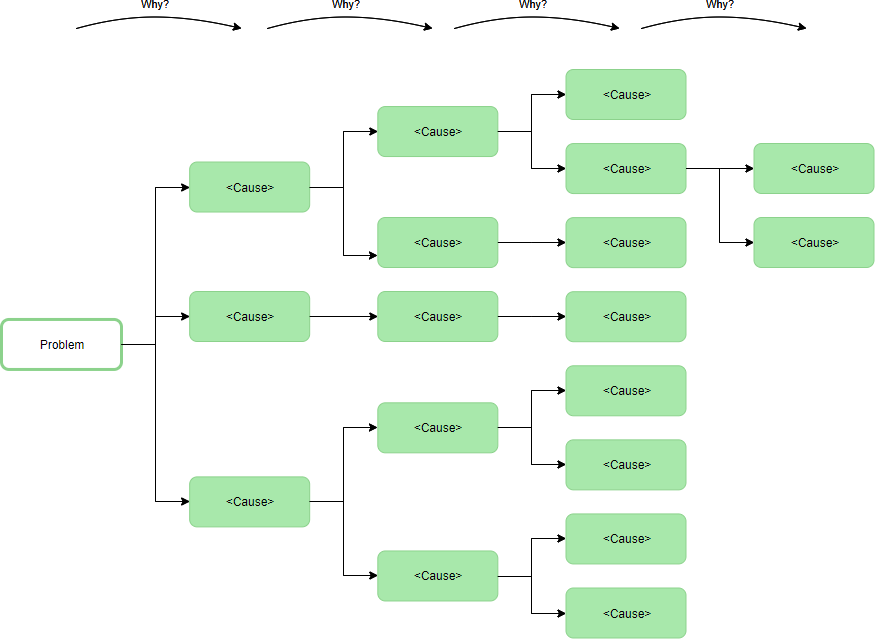
Edit this Why-Why diagram template
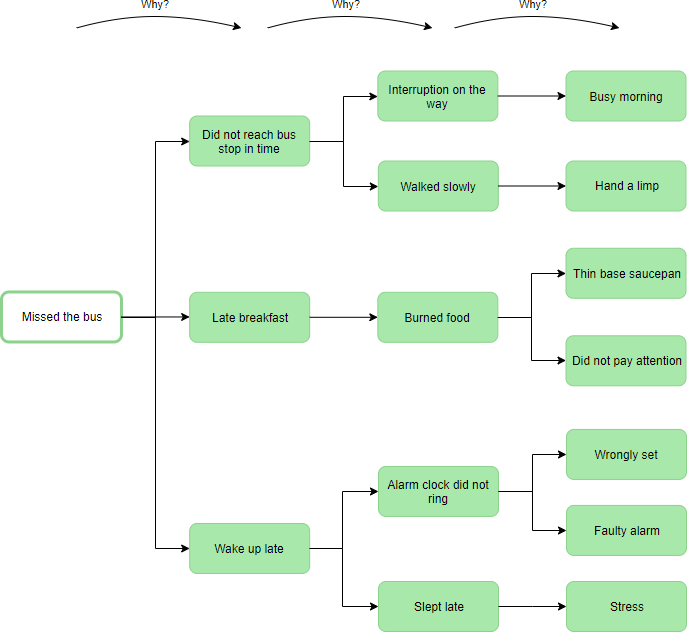
Tree Diagram Example
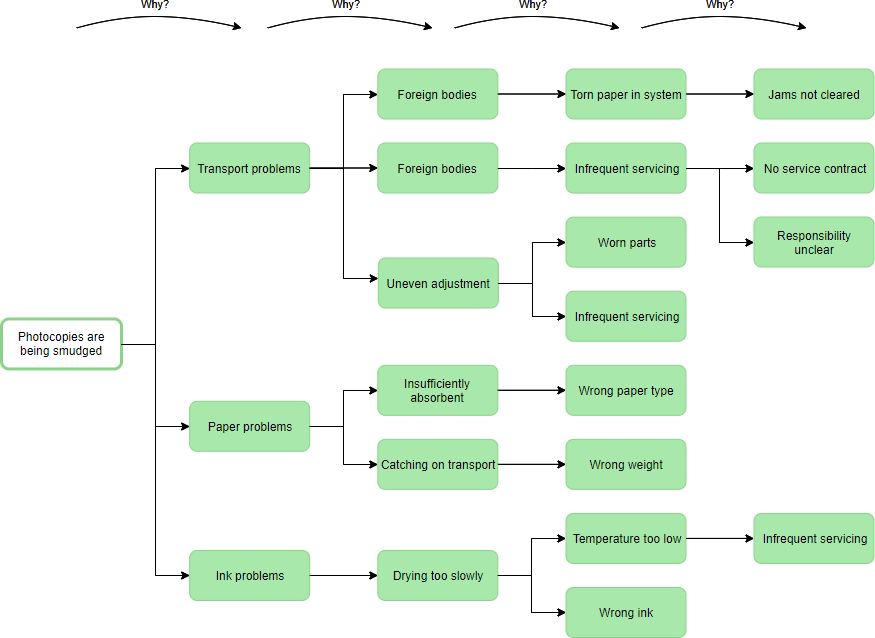
Edit this Why-Why diagram example
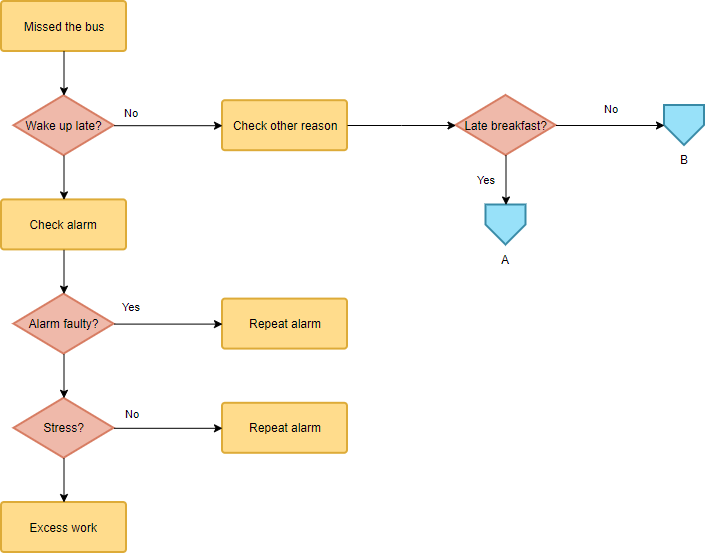
Tree Diagram vs Fault Tree Diagram vs Flowchart
Edit this Why-Why diagram example
Edit this Fault Tree Analysis example