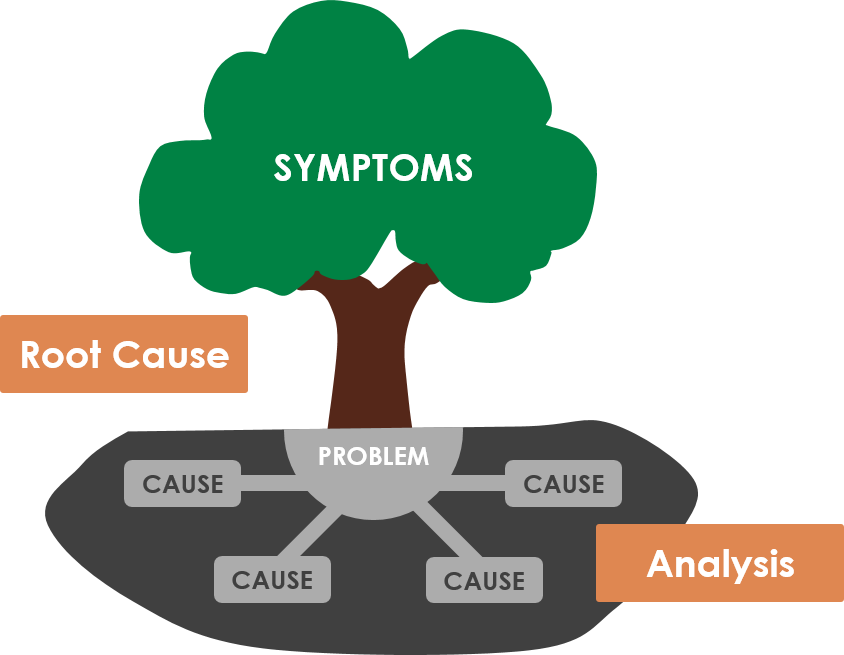
An interrelationship diagram (also known as relationship diagram, or relations diagram) is an analysis tool that allows a team to identify the cause-and-effect relationships among critical issues. The relations diagram is one of the 7 New QC Tools described in the Japanese classic “Management for Quality Improvement.
Why are they worthwhile? Because they make it easy to pick out the factors in a situation that are the ones who are driving many of the other symptoms or factors. The analysis helps a team distinguish between issues that serve as drivers and those that are outcomes. It is a powerful means of forcing a group to map out the interactions between factors and usually helps bring the most important issues into focus.
What is Interrelationship Diagram?
Instead of one item following another in a logical sequence, each item is connected to many other pieces, showing that they have an impact on each one. Once all the relevant connections between items have been drawn, the connections are counted. Those with the most connections will usually be the most important factors to focus on.
Create a Relations Diagram in 6 Steps:
- Agree on the issue or question.
- Add elements to the diagram involved in the issue.
- Compare each factor to all others. Use an “influence” arrow to connect related others.
- The arrows should be drawn from the element that influences to the one influenced.
- If two elements influence each other, the arrow should be drawn to reflect the stronger influence.
- Count the arrows.
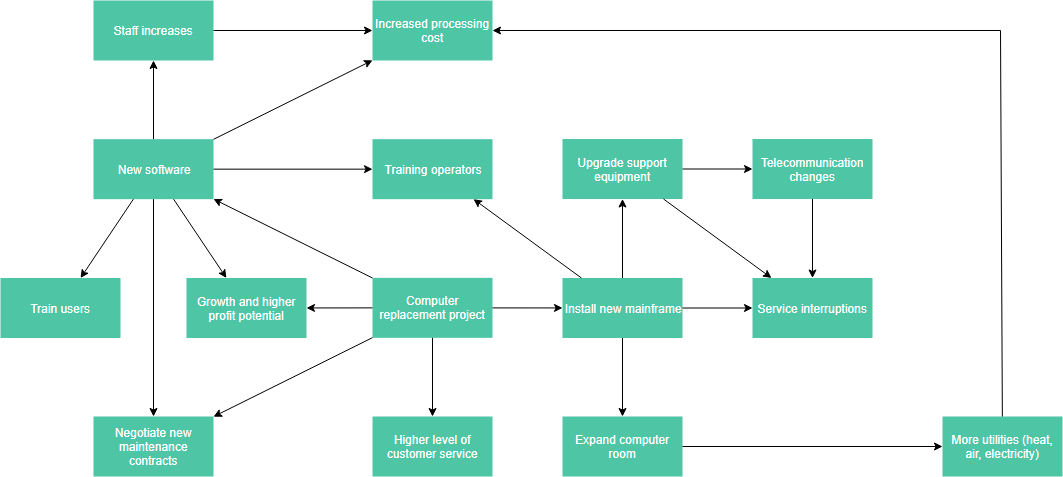
Interrelationship Diagram Example – The Effect of Replacing Mainframe Computer
A computer support group is planning a major project: replacing the mainframe computer. The group drew an interrelationship diagram (see figure below) to sort out a confusing set of elements involved in this project. (*Source: Example from ASQ.org)
Edit this Interrelationship Diagram Example
Interpretation of the Result
- The elements with the most outgoing arrows will be root causes or drivers.
- The ones with the most incoming arrows will be key outcomes or results.
Identify the Key Causes (Drivers)
After all the arrows were drawn, key issues became clear. They are outlined with bold lines.
- “New software” has one arrow in and six arrows out.
- “Install new mainframe” has one arrow in and four out. Both ideas are basic causes.
Identify the Key Effects
“Service interruptions” and “increased processing cost” both have three arrows in, and the group identified them as key effects to avoid.