The defect concentration diagram (also known as problem concentration diagram) is a visual illustration (i.e. a diagram or map) that is useful in analyzing the causes of the product or part defects. Typically, it is a drawing of the product (or other item of interest), with all relevant views displayed, onto which the locations and frequencies of various defects are shown.
Edit this Defect Concentration Diagram Example
When to Use Defect Concentration Diagram?
A concentration diagram can help researchers or quality control analysts determine whether there is a pattern in defects. Patterns or trends, when noted, allow a manufacturer to correct defects, reinforce areas, or change processing methods. It is a visual form of a check sheet that conveys a great deal of information a glance.
Defect concentration diagram is used effectively in the following situations:
- During the data collection phase of problem identification.
- Analyzing a part or assembly for possible defects.
- Analyzing a product (or a part of a product) being manufactured with several defects.
Create a Defect Concentration Diagram in 4 Steps
There are a number of steps that are needed to be followed when constructing the defect concentration diagram:
- Define the fault or faults (or whatever) being investigated.
- Make a map, drawing, or picture.
- Mark on the diagram each time a fault (or whatever) occurs and where it occurs.
- After a sufficient period of time, analyze it to identify where the faults occur.
Defect Concentration Diagram Example – Shaft Defect
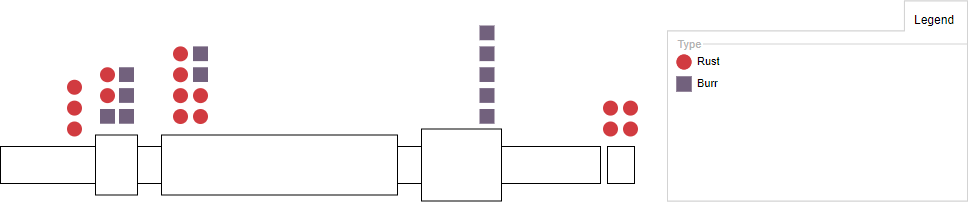
Edit this Defect Concentration Diagram Example
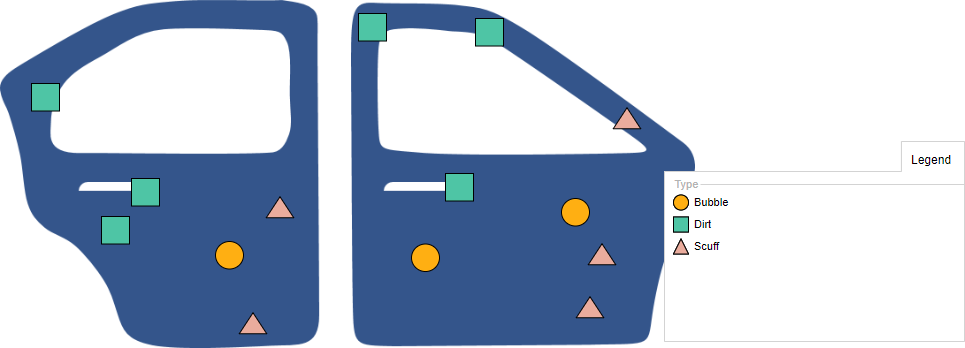
Defect Concentration Diagram Example – Car Door Defects