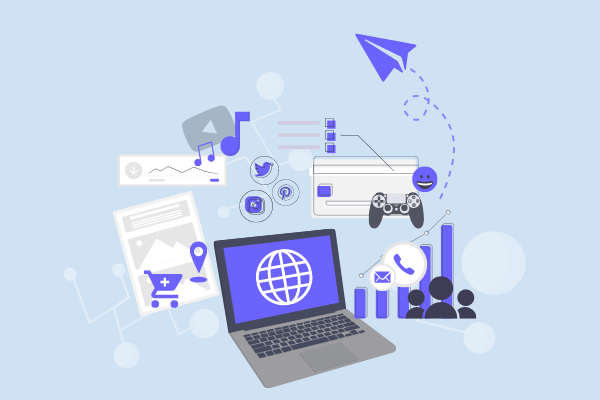
Big data is a collection of data that can not be captured, managed and processed by conventional software tools within the acceptable time range.
Technically, the relationship between big data and cloud computing is as inextricably linked as the front and back of a coin. Big data must not be processed with a single computer, and a distributed architecture must be adopted. It is characterized by distributed data mining of massive amounts of data, but it must rely on cloud computing distributed processing, distributed databases and cloud storage, virtualization technology.
Big data analytics can help enterprises use their data to seize new opportunities. Excellent data analysis will bring more intelligent business flow, more effective operation, higher profits and more accurate customers. So, what is the value of big data analytics:
Reduce the cost. Big data technologies and cloud based analysis bring significant cost advantages in storing large amounts of data - in addition, they can identify more effective ways to do business.
Faster and better decision making. The ability to analyze new data sources, enterprises can immediately analyze information and make decisions based on what they have learned.
New products and services. The ability to measure customer needs and satisfaction through analysis can identify customer needs.
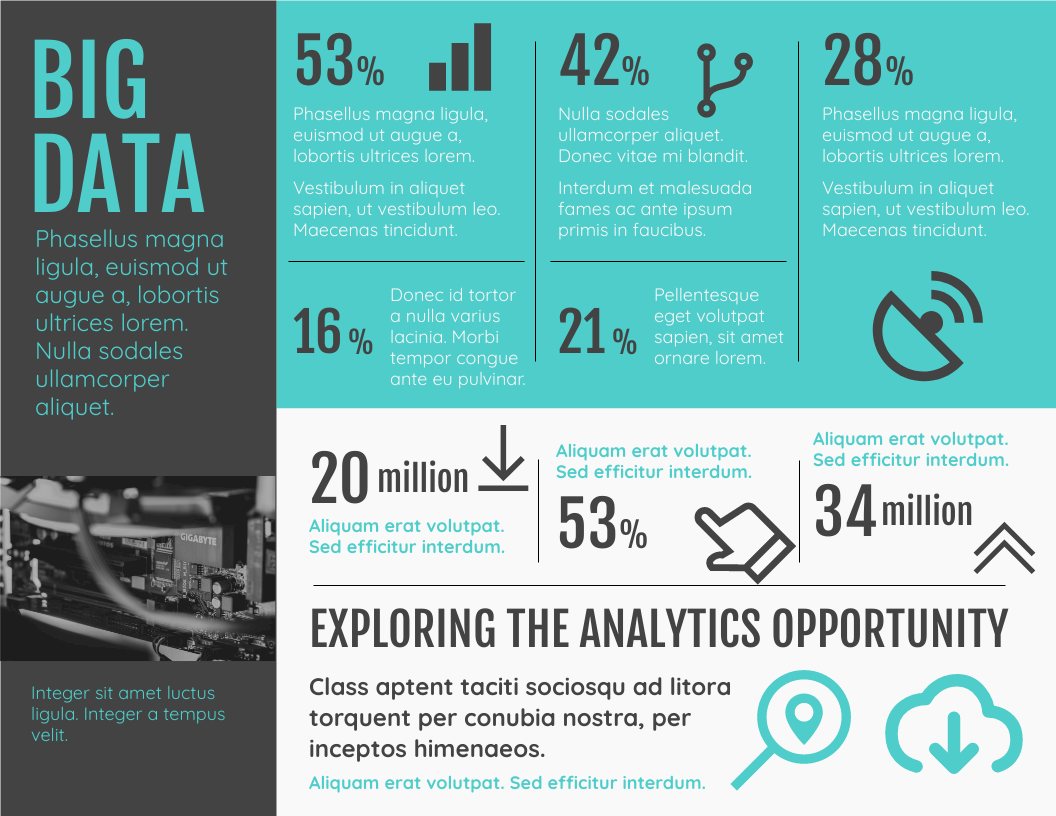
Big data
53%
42%
28%
16%
21%
20 million
53%
34 million
Exploring the analytics opportunity


)")


