Information graphics (or known as infographics) are graphic visual representations that help you understand the information for a particular theme. The graphics allow your target audience to get the desired information in a quick and more effective manner as compared to textual information. Infographics are used in almost every field you can find in the world.
With the passage of time, you can see different businesses using infographics for their branding. It is also used in the brochures, pamphlets, visiting cards and even on an advertisement regarding job openings.
What is Infographics?
An infographic is a collection of imagery, charts, and minimal text that gives an easy-to-understand overview of a topic. According to the Oxford English Dictionary, an infographic (or information graphic) is:
“A visual representation of information or data”.
Infographics use striking, engaging visuals to communicate information quickly and clearly. If you want to learn to make an engaging and concise infographic, this infographic tutorial is for you.
From the ordinary perspective of a non-professional designer, it may be difficult to make a beautiful and effective infographic, but in fact, it is not.
Before You Start to Your Design
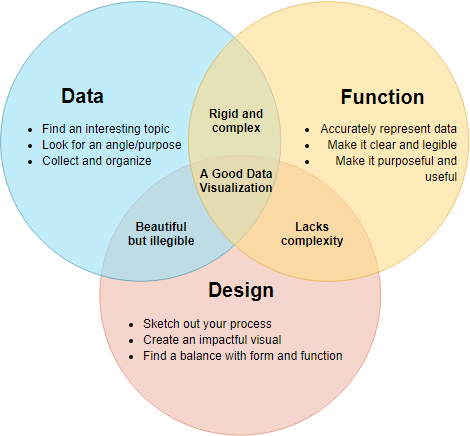
You can consider making an impressive infographic for visualizing information by considering the following three aspects as shown in the Venn Diagram below:
- Data
- Function
- Design
The common core of these three aspects provides the foundation for you to create an impressive and as well and informative piece of the infographic to your reader.
Infographic Example
There are many reasons why we failed to create new content. Looking at this infographic we can see the possible reasons that may be considered as a challenge when creating content. There are also tips we can follow to overcome these challenges and create enriching the content for our needs.
I use the example below to show you how to create impressive infographics by using infographics. But it’s crucial to remember that the visuals in an infographic must do more than excite and engage. They must help us understand and remember the content of the infographic as well.
As in the example below, marketing infographics use striking, engaging visuals to communicate information quickly and clearly. It is divided into three compartments:
- Key figures and factors to be considered
- Tips and steps for creating impressive infographics
- The top five challenges you will face
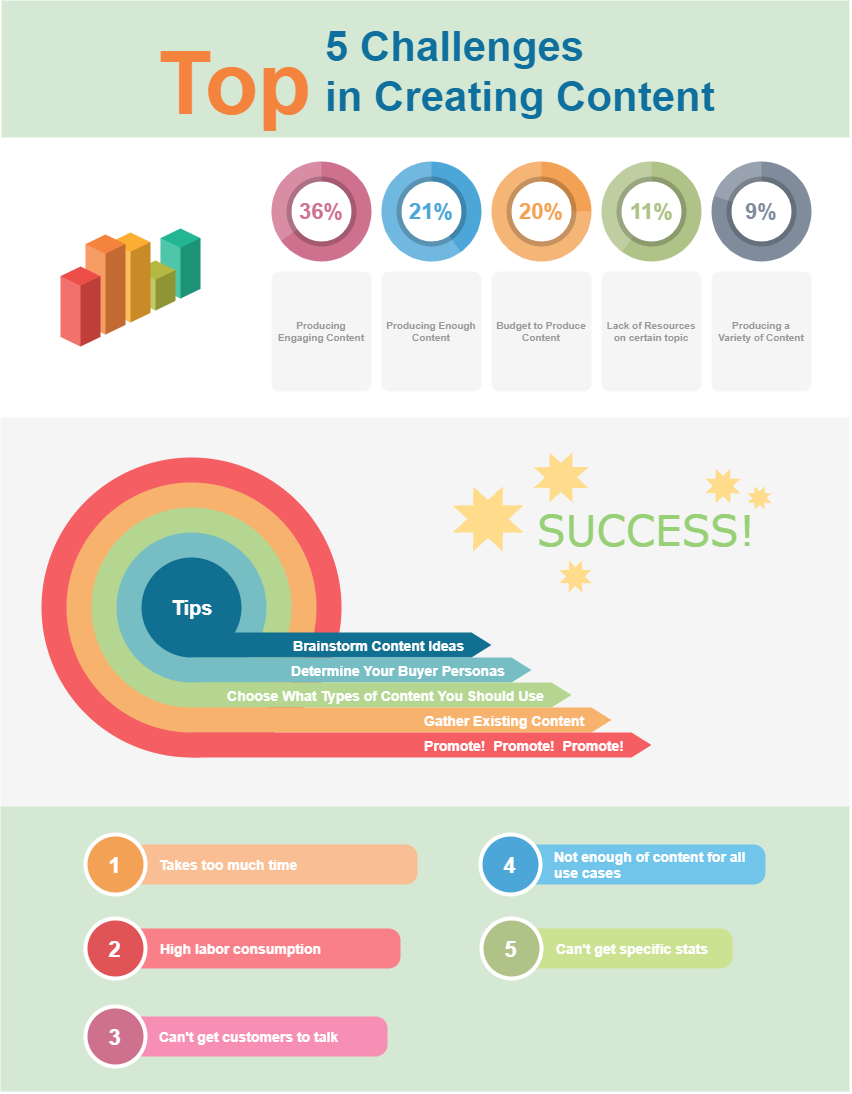
Follow the 5 step process to develop your infographics
- Brainstorm content ideas
- Determine Your Buyers Personas
- Choose what types of content you should use
- Gather existing content
- Promote your products
Free Online Infographic Software
Visual Parading Online provides a simple, intuitive infographic maker that helps you create an eye-catching and easily digestible infographic in minutes, and yet it is free and with the following benefits:
Easy-to-Use Infographic Maker
Everyone can be an infographic designer!
Visual Paradigm Online provides a simple, intuitive infographic maker that helps you create an eye-catching and easily digestible infographics in minutes.
Lack of ideas? No problem.
Our customizable infographic templates will help you become an infographic pro. Get inspired and create an infographic quickly with our beautifully designed infographic templates. Customize the design by adding your icons and images, changing the text and adjusting the font
Infographic Template – Why are infographics effective?
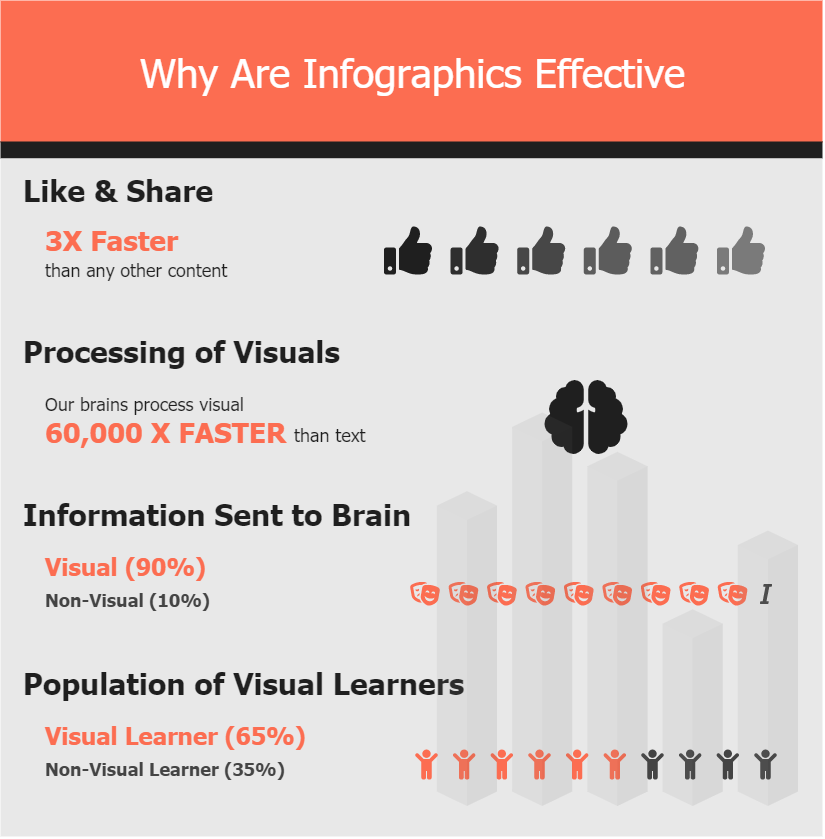
Edit this infographic template
Infographic Template – Successful financial planning process
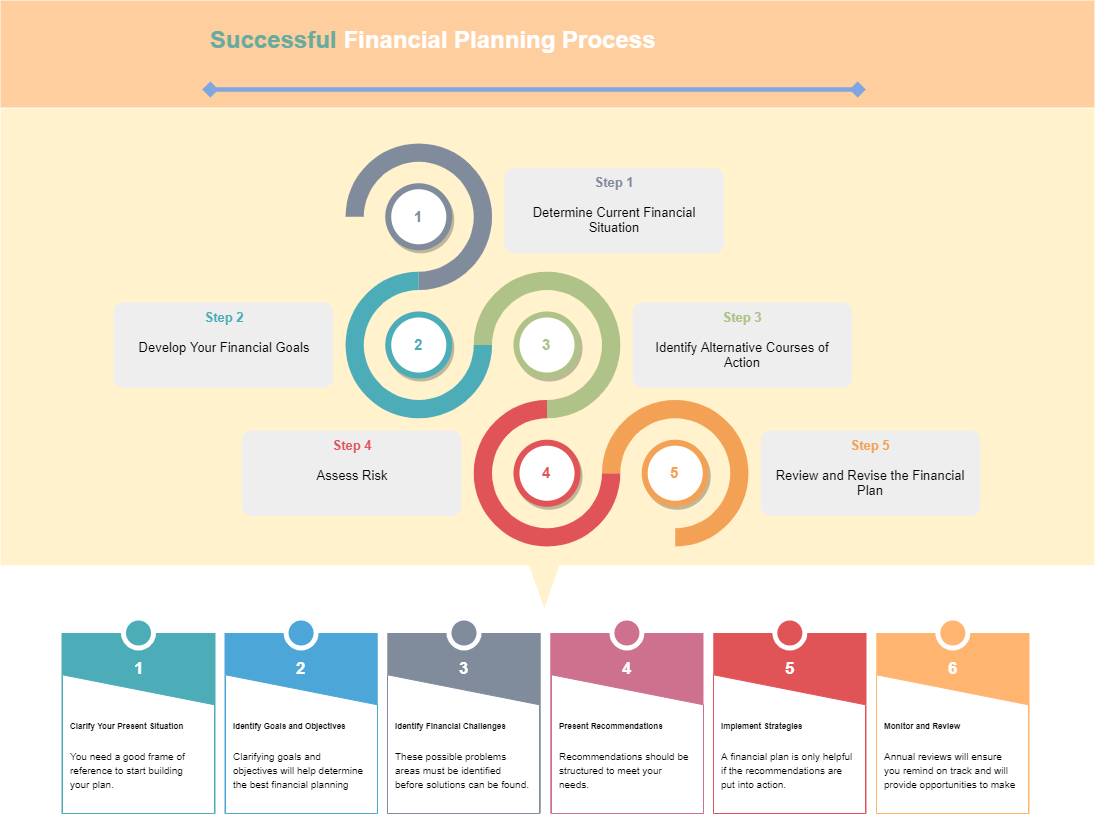
Edit this infographic template
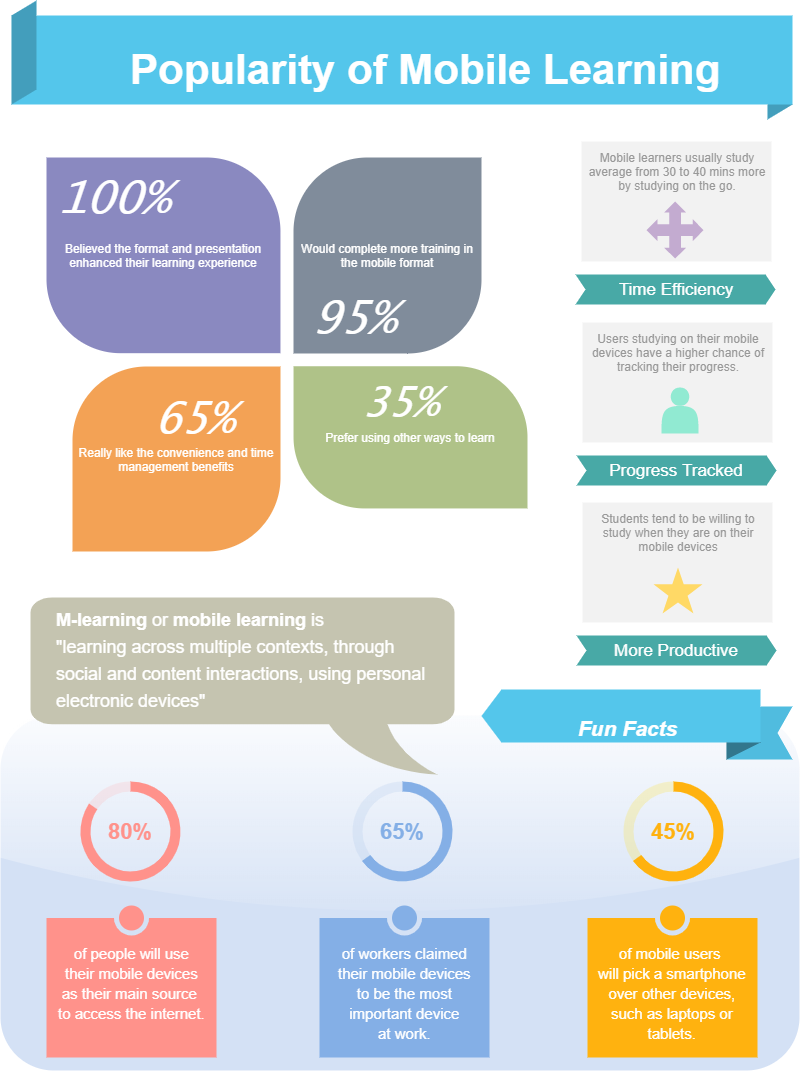
Infographic Template – The popularity of mobile learning