A Swimlane Flowchart (also known as opportunity flowchart, cross-functional flowchart) is a kind of flowchart, which visually distinguishes job sharing and responsibilities for sub-processes of a business process through the use of container boxes called swimlanes. Swim lanes may be arranged either horizontally or vertically. Swimlane diagram can be used for many different purposes including identifying value vs non-value processes, distinguished roles and responsibilities among departments in an organization and so on.
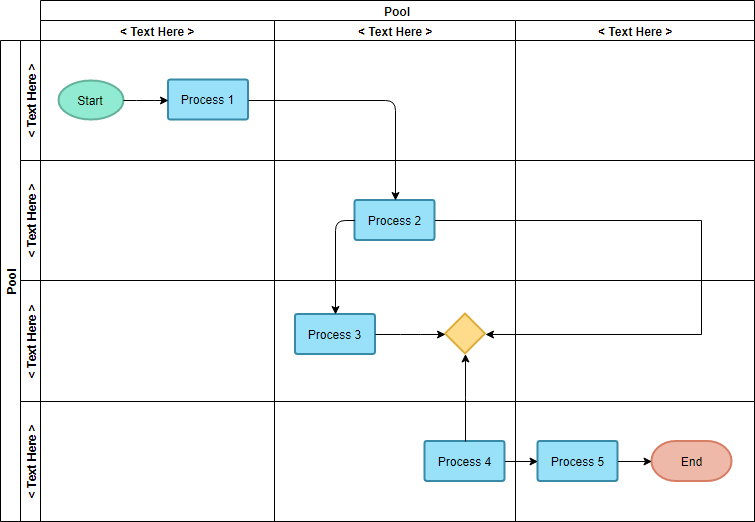
The following Swimlane diagram is a generic template that categorizes several processes into three vertical groups and four horizontal groups.
Edit this Swimlane Flowchart Example
Opportunity Flowchart
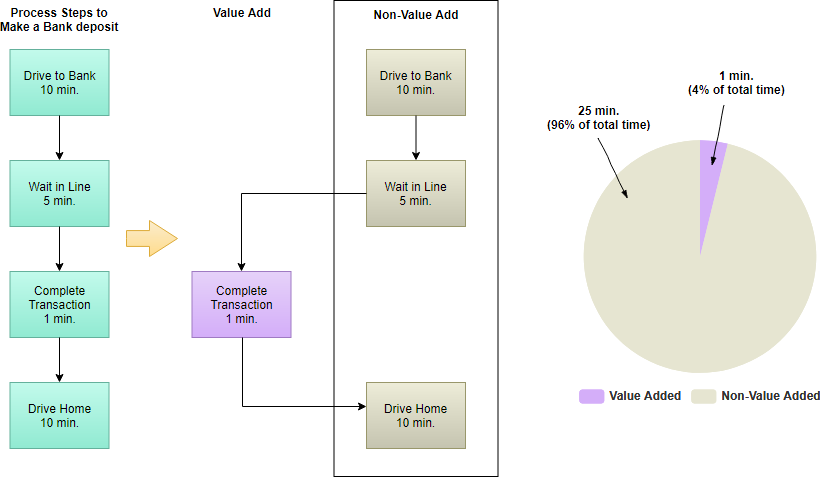
An opportunity flowchart is a variant of swimlane diagram which highlights non-value-added (NVA) steps, separating them in from value-added (VA) steps using two swim lanes. The proportion and type of NVA steps reveal important information about the improvements that should be considered.
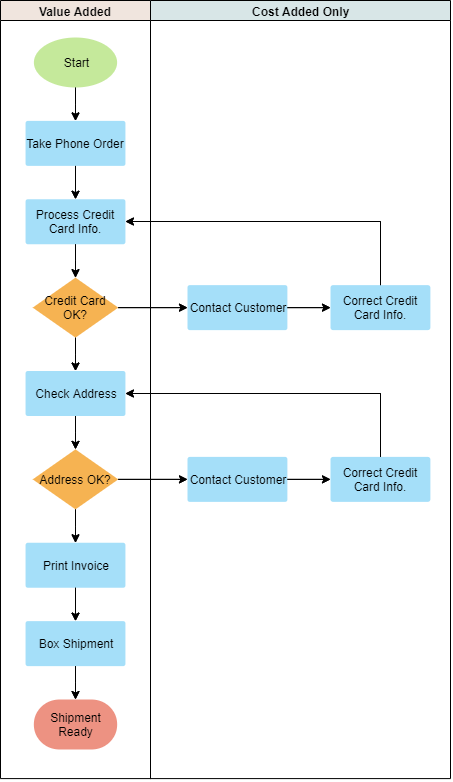
Edit this Opportunity Flowchart Example
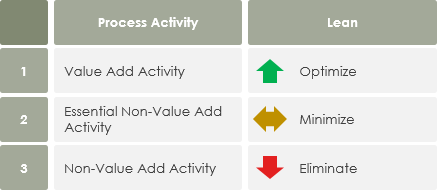
Value Added, Non-Value Added, Necessary Nonvalue Added Activities
Value-added activities are those processes that must be completed to satisfy your customer base. For example:
“There’s no way I’ll buy that unless you include…”
Nonvalue-added activities are production or service-related activities that simply add cost to, or increase time spent on, a product service without increasing its market value (i.e. 8 classic wastes). For example, the repair of machines, storage of inventory, moving materials, maintenance, and inspections
Necessary non-value adding activities don’t contribute to customer satisfaction that they must be done and they are essential and difficult to remove from the operation or production, i.e. comply with regulations or organizational policies, etc.
Note That:
Nonvalue-added activities consume resources but create no value for the customer. Even if they stopped and they would be invisible to the end-user or customer.
In conclusion, value-added activities should be further optimized for seeking continuous improvement and growth of an organization, while the non-value added activities should be eliminated, or at least minimized as much as possible.
Value and Non-Value Added Example – Deposit Money in ATM
A Cross-functional flow chart
A cross-functional flowchart shows not only the steps in a process but also explicitly illustrates who conducts each portion of a process. This type of chart thus reveals problems related to the excessive back-and-forth in a process, communication issues, and so on.
We can use a cross-functional flowchart to portray the relationship between the steps in a process and the departments or functional areas that are responsible for those steps. For example, the category can be a stakeholder (person, role, or department), but it can also be a machine, a project phase, a resource, or some other attribute. Once problems are identified, they can be prioritized and addressed through the DMAIC process in Six Sigma.
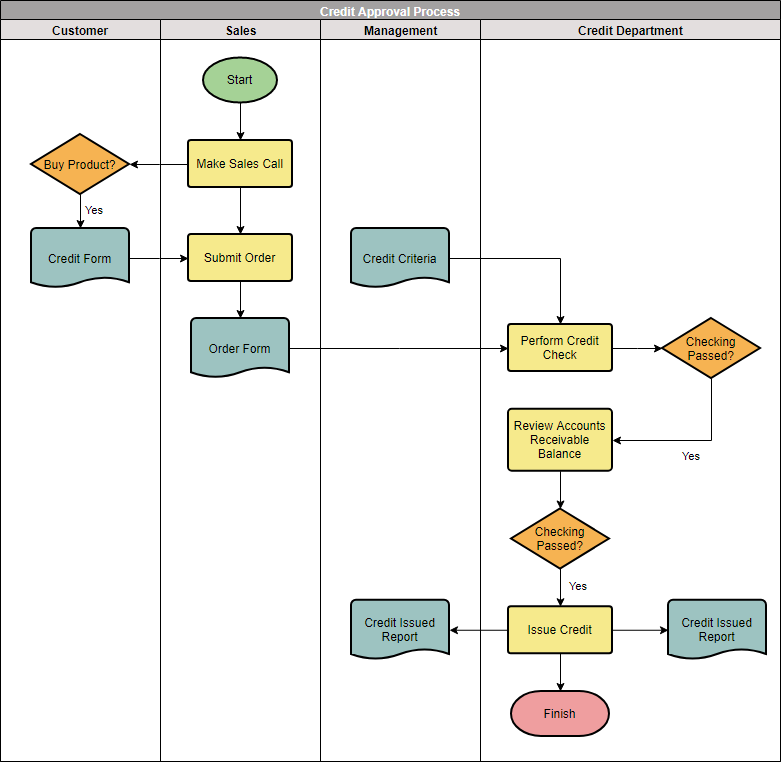
Cross-Functional Flowchart Example – Payroll Process
The purchase order process flowchart shows the credit approval process of a purchase order (PO) from the creation order form, through credit review and approval by going through three different departments (Sales, Credit Department, and Management):