DMAIC refers to a data-driven quality strategy for improving processes and is an integral part of the company’s Six Sigma Quality Initiative. DMAIC is an acronym for five interconnected phases: Define, Measure, Analyze, Improve, and Control.
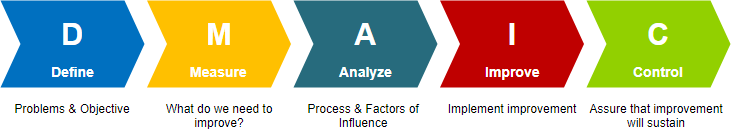
The 5 Step DMAIC Approach
The DMAIC approach is designed to allow for flexibility and iterative work. It is an acronym that stands for Define, Measure, Analyze, Improve, and Control. It represents the five phases that make up the process, including the tools to use to complete those phases. Each step in the cyclical DMAIC Process is required to ensure the best possible results. The process steps:
1. Define the problem, improvement activity, opportunity for improvement, the project goals, and customer (internal and external) requirements.
- Define who customers are, what their requirements are for products and services, and what their expectations are
- Define project boundaries the stop and start of the process
- Define the process to be improved by mapping the process flow
Tool Used:
- Project Charter
- Process Flowchart
- SIPOC Diagram
- Stakeholder Analysis
- DMAIC Work Breakdown Structure
- CTQ Definitions
- Voice of the Customer Gathering
2. Measure the performance of the Core Business Process involved.
- Develop a data collection plan for the process
- Collect data from many sources to determine types of defects and metrics
- Compare to customer survey results to determine the shortfall
Tool Used:
- Process Flowchart
- Data Collection Plan/Example
- Benchmarking
- Measurement System Analysis/Gage R&R
- Voice of the Customer Gathering
- Process Sigma Calculation
3. Analyze the data collected and process maps to determine the root causes of defects and opportunities for improvement.
- Identify gaps between current performance and goal performance
- Prioritize opportunities to improve
- Identify sources of variation
Tool Used:
- Histogram
- Pareto Chart
- Time Series/Run Chart
- Scatter Plot
- Regression Analysis
- Cause and Effect/Fishbone Diagram
- 5 Whys
- Process Map Review and Analysis
- Statistical Analysis
- Hypothesis Testing (Continuous and Discrete)
- Non-Normal Data Analysis
4. Improve the target process by designing creative solutions to fix and prevent problems.
- Create innovate solutions using technology and discipline
- Develop and deploy implementation plan
Tool Used:
- Brainstorming
- Mistake Proofing
- Design of Experiments
- Pugh Matrix
- QFD/House of Quality
- Failure Modes and Effects Analysis (FMEA)
- Simulation Software
5. Control the improvements to keep the process on the new course.
Tool Used:
- Process Sigma Calculation
- Control Charts (Variable and Attribute)
- Cost Savings Calculations
- Control Plan