Some many tools and techniques can be applied to strategy analysis. If you do an internet search you will find all sorts of options available. The challenge is selecting the best approach, tools, and techniques to use given the business problem or opportunity. This article covers 12 essential and the most popular strategy analysis tools for companies to implement their strategic plans and achieve a sustained competitive advantage.
1. Vision Statement
A vision statement identifies where the organization wants or intends to be in the future or where it should be to best meet the needs of the stakeholders. Every project needs a vision to steer itself in a proper direction. A vision serves as a guide for choosing the current as well as the future course of action.
Example Vision Statement
Microsoft’s vision
“To empower people through great software, any time, any place, or any device.”
A vision statement is for the organization and its members, unlike the mission statement which is for the customers and an effective Vision Statement should be:
- It should be unambiguous.
- It should be clear.
- It should be harmonized with the organization’s culture and values.
- It should be rational/realistic.
- It should be shorter so that they are easier to memorize
Vision Statement
A project or business initiative mostly starts with a vision of the product or system to be developed. The product vision in a project is a brief statement of the desired future state that would be achieved by developing and deploying a product.
A properly envisioned project provides a definitive path that can best fulfill the project’s objectives or goals. It also provides a common understanding of the direction they want to move towards. Besides that, the Product vision also supports the team in prioritizing what features to build first, in what order, and what not to build for the Product.
A nice way to start with your vision statement is by using the vision statement template as shown below (Of course this is just an example to get you started, you don’t have to force your vision into this template):
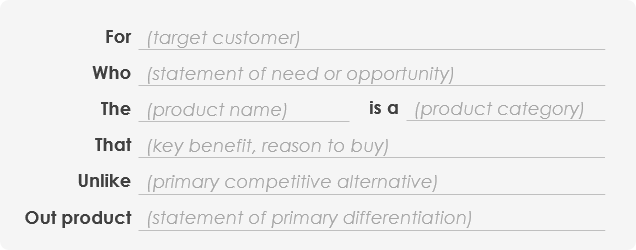
Project Vision Statement template
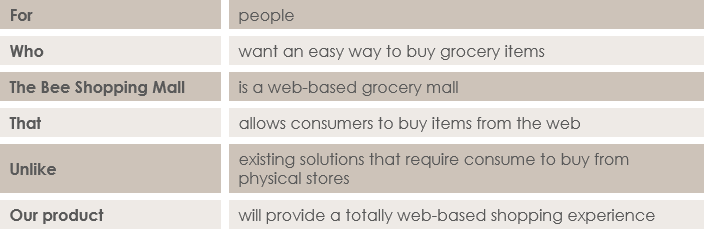
An Example: Online shopping mall
2. PEST & PESTEL Analysis
The PEST analysis is a useful tool for understanding market growth or decline, and as such the position, potential and direction for a business. PEST is an acronym for Political, Economic, Social and Technological factors, which are used to assess the market for a business or organizational unit. Sometimes it’s expanded to include legal and environmental factors and called a PESTLE analysis.
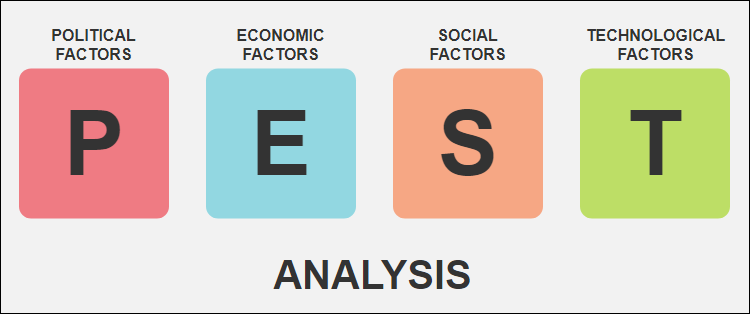
PEST Analysis
A PEST analysis guides us to identify effective strategies for setting priority, allocating resources, planning for time and development roadmap and formulating control mechanisms. With this analysis, you can identify potential opportunities and threats associated with your strategy and figure out ways to take advantage of them and avoid them.
PEST Analysis Example
The figure below shows a PEST Analysis example of the new energy vehicles industry.
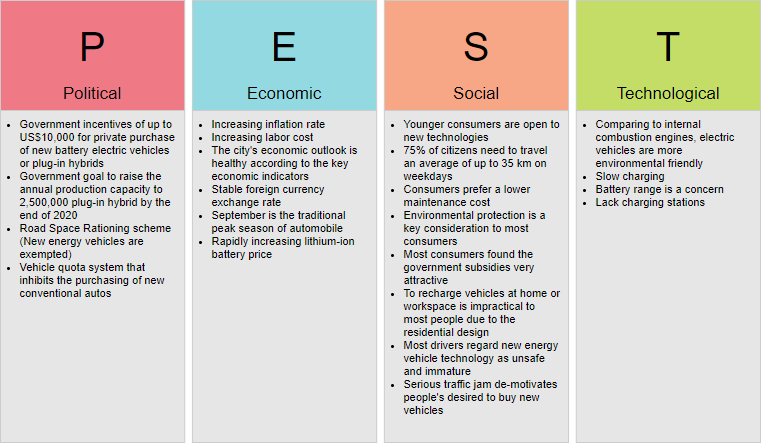
Edit this PEST Analysis example
PEST Analysis Variants
Traditionally, PEST analysis focuses on political, economic, sociological and technological factors, but increasing awareness of the importance of legal, environmental and cultural factors has led to the evolution of a growing number of variants. For example, PESTLIED – Political, Economic, Socio-Cultural, Technological, Legal, International, Environmental, Demographic.
PESTLE Analysis Example
The figure below shows a PESTLE Analysis example of a pharmaceutical company. PESTLE is a varied form of PEST. It has two additional columns L and E for listing the Legal and Environmental factors.
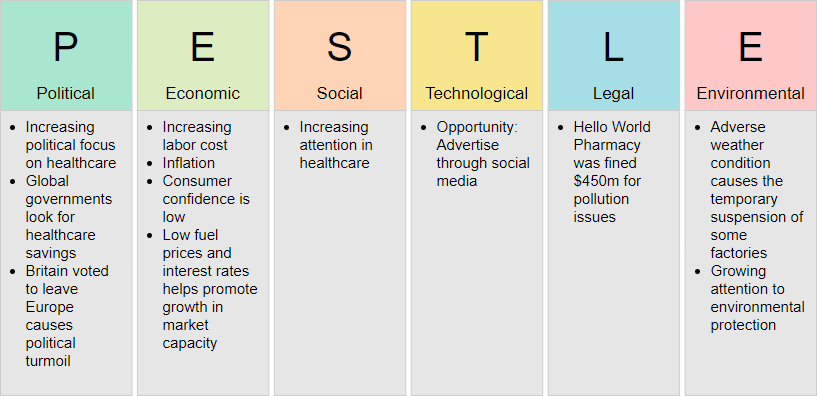
Edit this PESTLE Analysis example
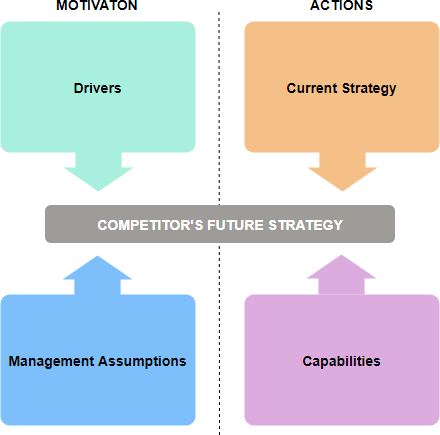
3. Porter’s Four Corners Model
The Four Corners Analysis developed by Michael Porter is a model well designed to help company strategists assess a competitor’s intent and objectives, and the strengths it is using to achieve them. It is a useful technique to evaluate competitors and generate insights concerning likely competitor strategy changes and determine competitor reaction to environmental changes and industry shifts. By examining a competitor’s current strategy, future goals, assumptions about the market, and core capabilities, the Four Corners Model help analysts address four core questions:
Motivation – What drives the competitor? Look for drivers at various levels and dimensions so you can gain insights into future goals.
Current Strategy – What is the competitor doing and what is the competitor capable of doing?
Capabilities – What are the strengths and weaknesses of the competitor?
Management Assumptions – What assumptions are made by the competitor’s management team?
Four Corners Analysis Example
The figure below shows a Four Corners Analysis Example that involves the strategic analysis of a rival fast-food restaurant.
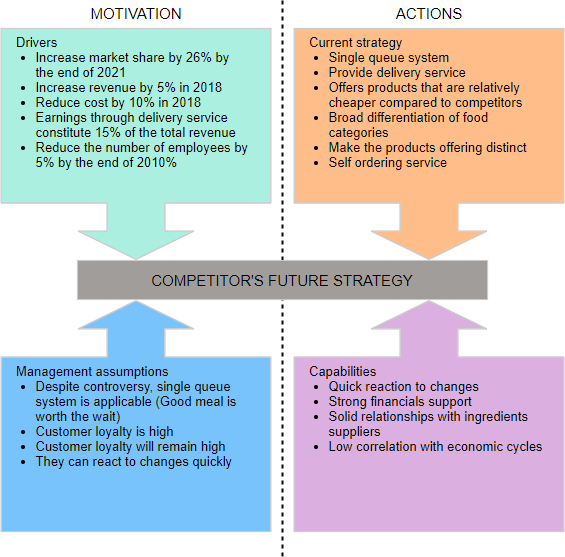
Edit this Four Corners Analysis example
4. Competitor Analysis
Competitor analysis in marketing and strategic management is an assessment of the strengths and weaknesses of current and potential competitors. This analysis provides both an offensive and defensive strategic context to identify opportunities and threats. Profiling combines all of the relevant sources of competitor analysis into one framework in the support of efficient and effective strategy formulation, implementation, monitoring, and adjustment.
Competitor Analysis Map
This can be displayed on a two-dimensional matrix – competitors along the top and key success factors down the side. An example of a competitor array follows:
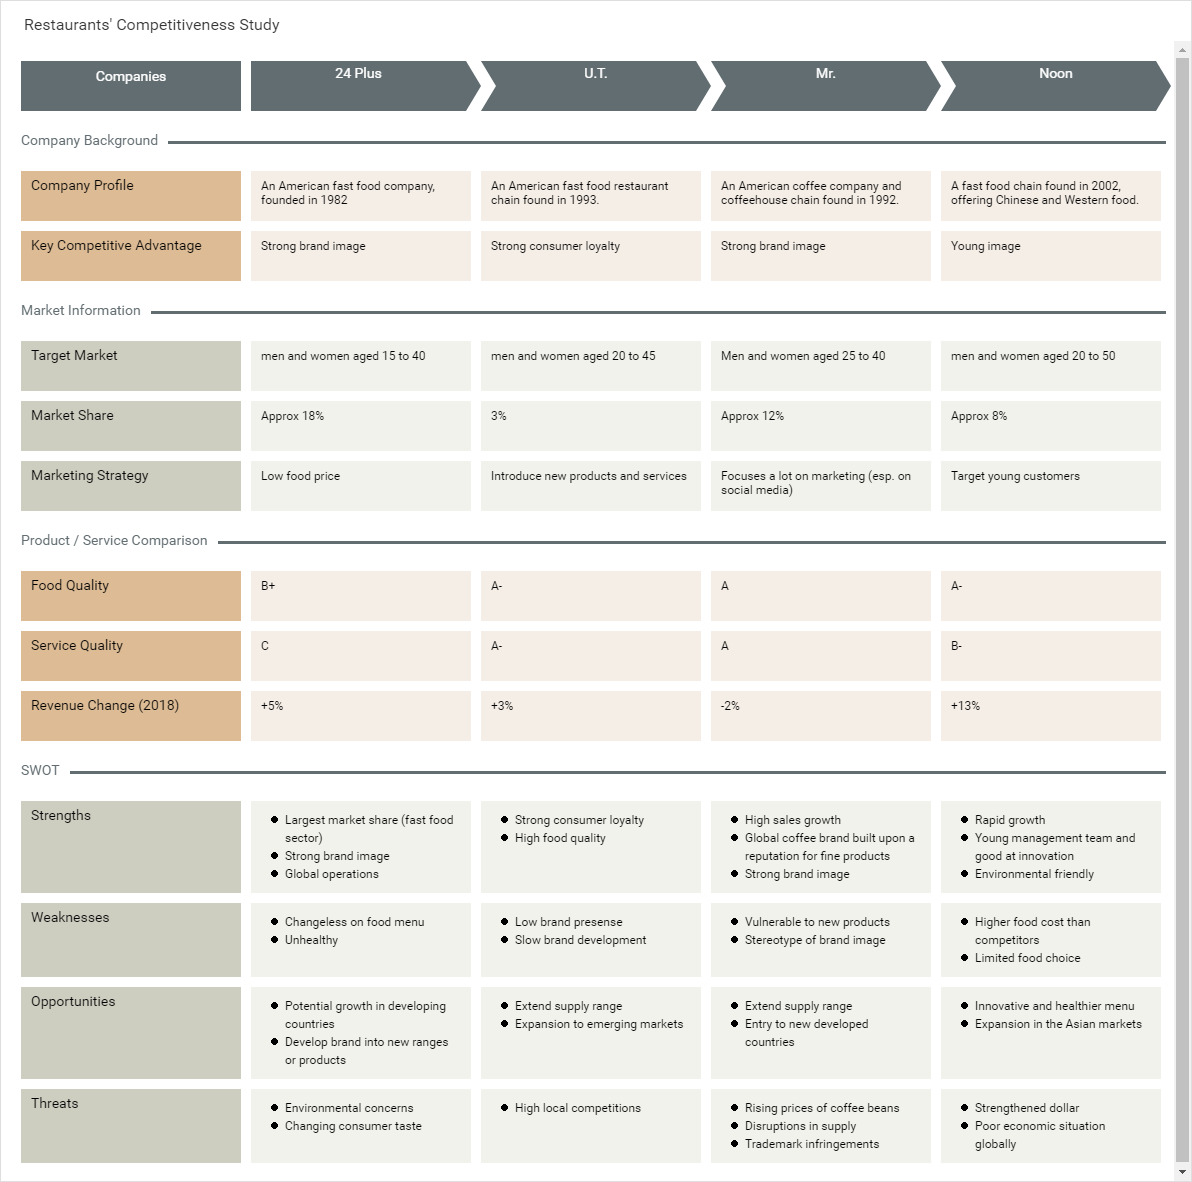
Edit this Competitor Analysis example
You can integrate a competitor Analysis with SWOT Analysis to give more insight into your strengths, weaknesses, opportunities, and threats in comparison to your competitors.
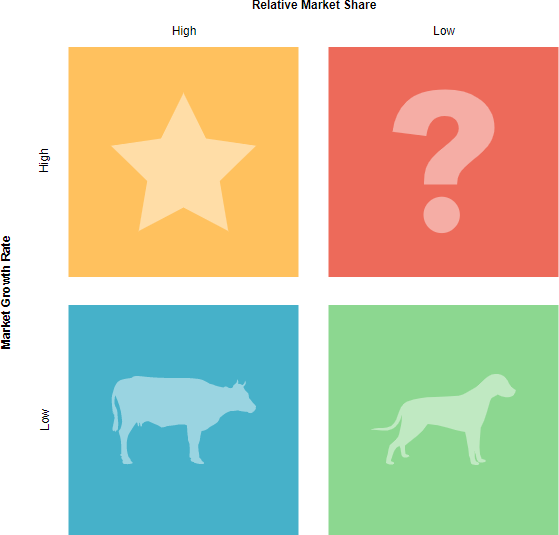
5. Boston Consulting Group (BCG) Matrix
Henderson developed the Boston Consulting Group (BCG) Matrix in 1970. The BCG Matrix is a simple grid with Market Growth on one axis, and Market Share on the other:
- Low or High based on industry attractiveness, i.e. is the market in which the product is being sold growing quickly, slowly, or not at all?
- The competitive position of the relative market share, i.e. does the product have a high or a low share of the current market?
Each product in a business will be assessed against both of these criteria and then placed into the matrix. This will result in each product of the portfolio falling into one of four categories:
1. Cash Cows
These are products with a high-market-share in a slow-growing market. They are profitable, generating good margins, and throwing off excess cash without the need for significant investment. Cash Cows need to be milked for profits but given minimum investment. In a nutshell, we want to milk these products without killing the cow!
2. Stars
These are products with a high-market-share in a growth market. These stars have the potential to provide a high proportion of the future profits of the business. It is thus advisable for a business to invest in these products to maintain market leadership, thus securing future profits as the market continues to grow.
3. Dogs
These are products with a low market share in low-growth markets. If these products are not profitable you may wish to divest them or consider a red ocean strategy. If a dog is profitable you should invest as little as possible into it, or even consider divesting it.
4. Question Marks
These are products with a low market share in a high-growth market. Because of this their growth-rate going forward is unclear and further investigation is needed to decide what to do with these products. These products might become stars, but equally, they might crash and burn as it’s not easy to spot a future star.
BCG Matrix Template
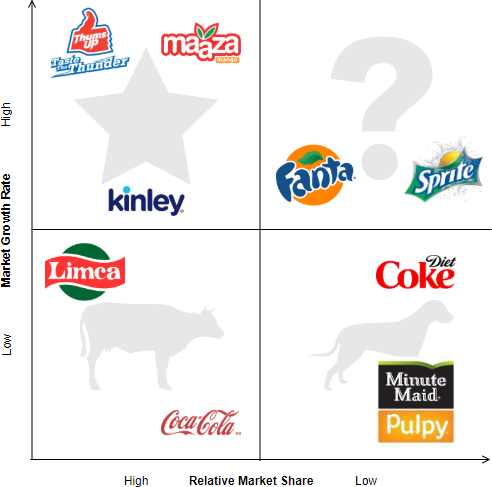
BCG Matrix Example – Soft Drinks
THUMPS UP- It is in star position. To maintain a large market share heavy investment is needed. Also, popular among youth and largely produced by the Coca-Cola company to keep up with the demand. It has the potential to hold the position. Thus, market share and growth are high.
Limca- Lemon flavored Lime, once one of the market leaders, now low in growth in the market. Having enough market share to put the product on stores, Limca is in the position of Cash cows. Growth is low and share is high.
Diet Cock- Coca-Cola has launched Diet Cock for health-conscious consumers of Coca-Cola. The drink has received favorable responses in the past but the latest data suggests it is dwindling in popularity. Many health-aware customers can see the potential of Diet Cock in the future, but the growth among other Diet health drinks is impossible. Thus, I mark it as Dogs.
Sprite- Question marks products have small relative market share but high market growth rate. Sprite as a soft drink is highly popular and has the potential to become a star product.
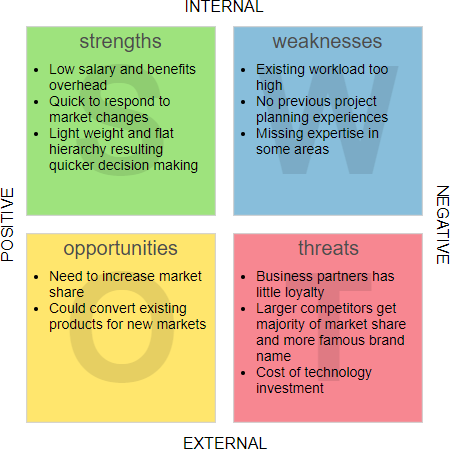
6. SWOT Analysis
SWOT analysis is a technique developed at Stanford in the 1970s, frequently used in strategic planning. SWOT is an acronym for Strengths, Weaknesses, Opportunities, and Threats and is a structured planning method that evaluates those four elements of an organization, project or business venture. A SWOT analysis is a simple, but powerful, framework for leveraging the organization’s strengths, improving weaknesses, minimizing threats, and taking the greatest possible advantage of opportunities.
SWOT Analysis Template
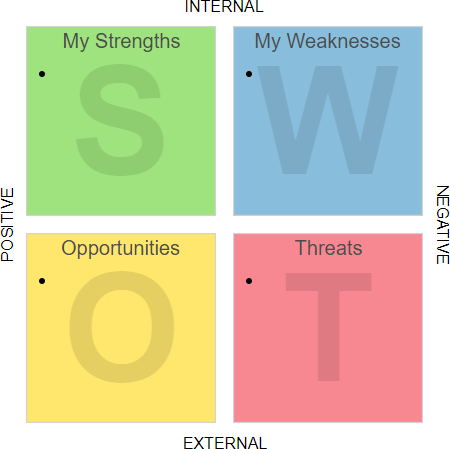
Edit this SWOT analysis template
SWOT Analysis Example – Internet Small Business Startup
Edit this SWOT analysis example
Action Plan
As you use the SWOT Analysis for planning, you align the positive elements to help take advantage of opportunities and identify the gaps in the negative elements that must be improved or managed. Driving to implications from the SWOT requires us to take a strategic leap, looking at the connections across the categories (e.g. where does strength help us mitigate a threat), as well as looking holistically across for trends.
- Strength – Maintain low overhead by changing pay structure to balance basic pay with performance-based bonuses
- Weakness – Study, research and implement project planning system and follow it
- Opportunity – Test new market with one existing product first
- Threats – include the business partner in a performance-based commission scheme
7. Value Chain Analysis
Value chain analysis is a way to visually analyze a company’s business activities to see how the company can create a competitive advantage for itself. Value chain analysis helps a company understand how it adds value to something and subsequently how it can sell its product or service for more than the cost of adding the value, thereby generating a profit margin. In other words, if they are run efficiently the value obtained should exceed the costs of running them i.e. customers should return to the organization and transact freely and willingly.
Originated in the 1980s by Michael Porter, value chain analysis is the conceptual notion of value-added in the form of a value chain. He suggested that an organization is split into ‘primary activities’ and ‘support activities’. The figure below divides activities into primary and support activities as suggested by Porter’s Value Chain Analysis model:
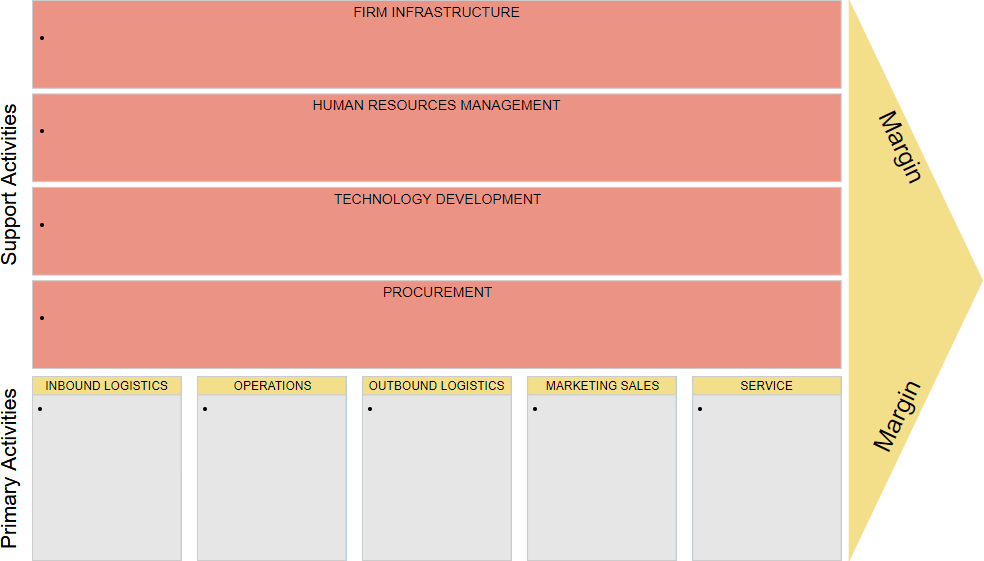
Create a value chain analysis diagram
Value Chain Diagram Example – SuperStore Super Market
Value chain analysis is based on the principle that organizations exist to create value for their customers. In the analysis, the organization’s activities are divided into separate sets of activities that add value. The organization can more effectively evaluate its internal capabilities by identifying and examining each of these activities. Each value-adding activity is considered to be a source of competitive advantage.
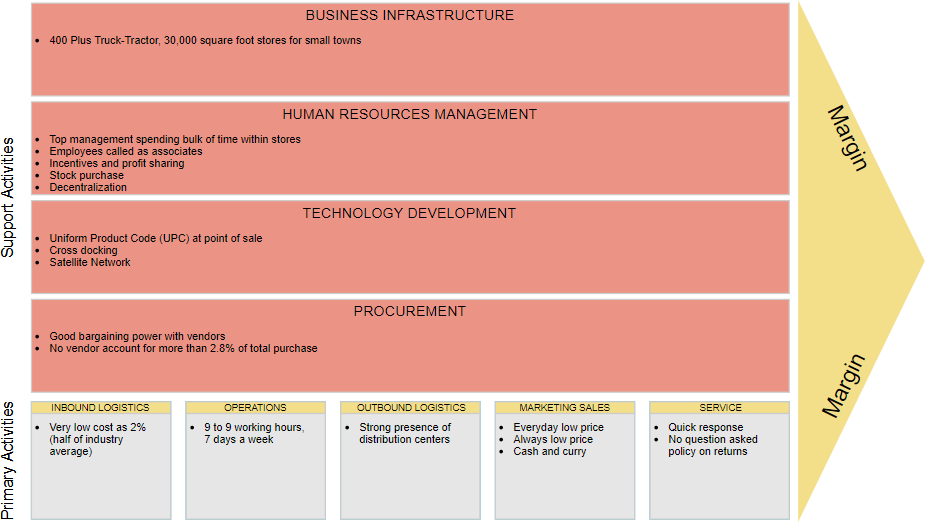
Edit this Value Chain Analysis example
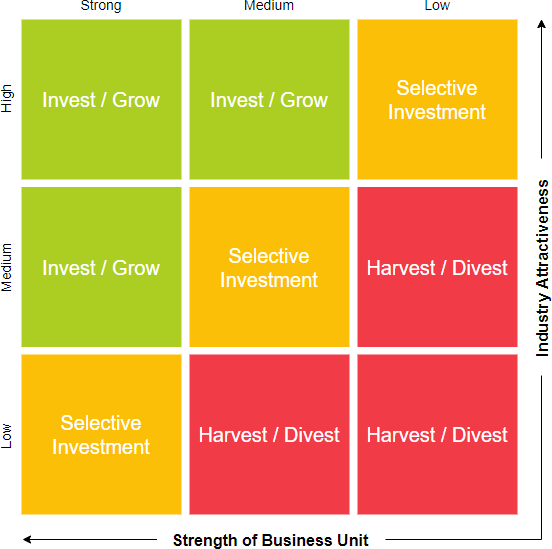
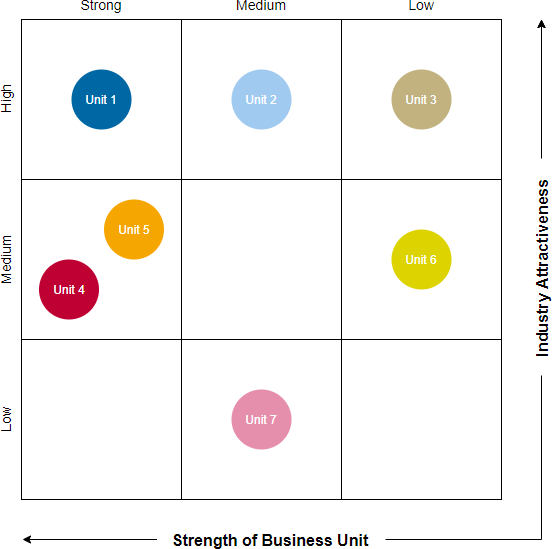
8. GE McKinsey Matrix
The GE McKinsey matrix is a nine-box matrix that is used as a strategy tool. It helps multi-business corporations evaluate business portfolios and prioritize investments among different business units in a systematic manner.
The matrix is a 3×3 grid to provide a more fine-grained view of the strategic position of a business unit or product than the simple 2×2 BCG matrix. The Y-axis measures market attractiveness while the x-axis measures the business strength. The scale is high, medium and low. A few key steps are necessary to create this matrix.
Edit this GE McKinsey matrix template
GE McKinsey Matrix Template – 9-box GE McKinsey Grid
Edit this 9-Box GE McKinsey grid
9. VRIO Framework
VRIO framework is the tool used to analyze a firm’s internal resources and capabilities to find out if they can be a source of sustained competitive advantage developed by J. B. Barney in 1991. VRIO is the acronym for the four (4) basic questions the framework evaluates over capabilities and resources:
- Valuable? “Is the firm able to exploit an opportunity or neutralize an external threat with the resource/capability?”
- Rare? “Is control of the resource/capability in the hands of a relative few?”
- Inimitable? “Is it difficult to imitate, and will there be significant cost disadvantage to a firm trying to obtain, develop, or duplicate the resource/capability?”
- Organized? “Is the firm organized, ready, and able to exploit the resource/capability?” “Is the firm organized to capture value?”
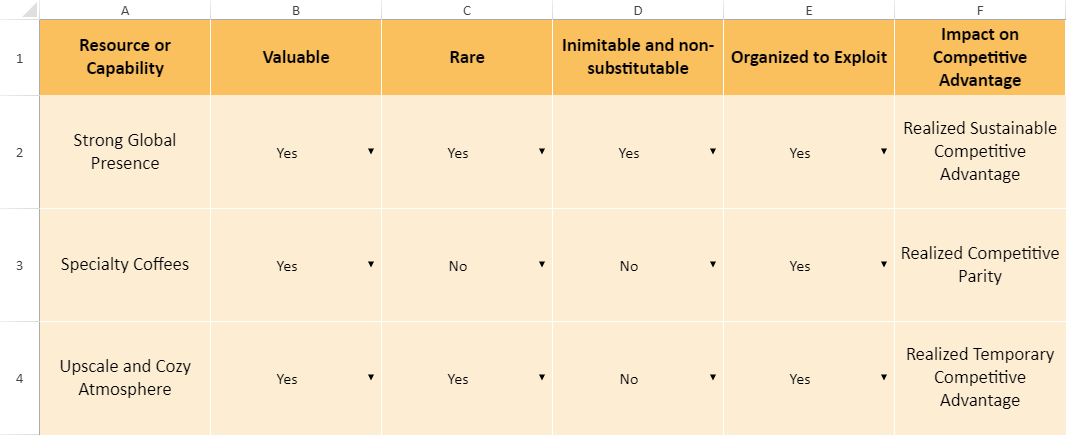
VRIO Analysis Example – Starbucks Coffee Shop
This analysis will compare the resources and capabilities of Starbucks to determine if either one has a competitive advantage over the other. The goal is to have a realized sustainable competitive advantage that will maximize their potential in these areas.
Edit this VRIO analysis example
In the example above, let’s examine the first factor “Strong Global Presence”. We can summarize the finding as follows:
Valuable: Having a strong global presence is an important asset for a company trying to increase its size, sales, and market share. It is a great way to gain more revenues from new and existing consumers. Rare: Starbucks is the biggest coffee corporation globally. Although there are other global coffee chains, Starbucks is the most recognizable.
Inimitable and Non-substitutable: In the short term, no competitors of Starbucks could gain such a large global presence. It would take significant time and resources to accomplish this.
Organized to Exploit: Starbucks is successfully taking advantage of this capability. As quoted on their website: “With more than 5,500 coffeehouses in over 50 countries, it’s clear that our passion for great coffee, genuine service, and community connection transcends language and culture.”
Impact on Competitive Advantage: Realized Sustainable Competitive Advantage
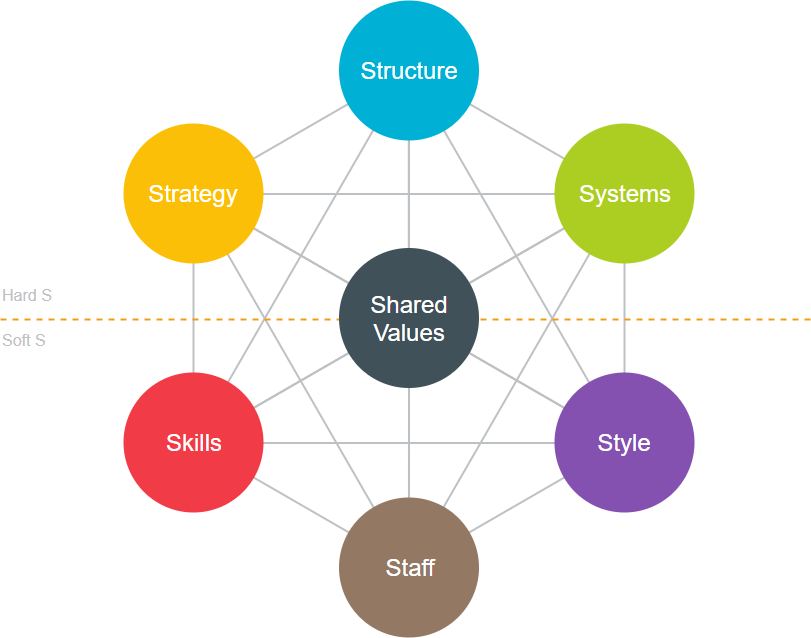
10. McKinsey 7s Model
The 7s Model by McKinsey is the strategic tool by the partners of McKinsey Consultants. Since the inception of the model, the McKinsey 7s Framework is one of the widely famous strategic planner tools and is used by various academic organizations and renowned practitioners. It analyzes the company’s organizational design by looking at the 7 different internal elements:
Edit this McKinsey 7S framework template
The shape of the model represents the interconnectedness of all the seven elements and divides them into the ‘Soft Ss’ and ‘Hard Ss’.
The 7s Model highlights and helps the organization understand how these elements can be well aligned together to attain high efficiency and effectiveness in the overall business processes. All the seven elements are interconnected and change in one element requires the related alteration in the others for the firm to function effectively.
7s Model Template
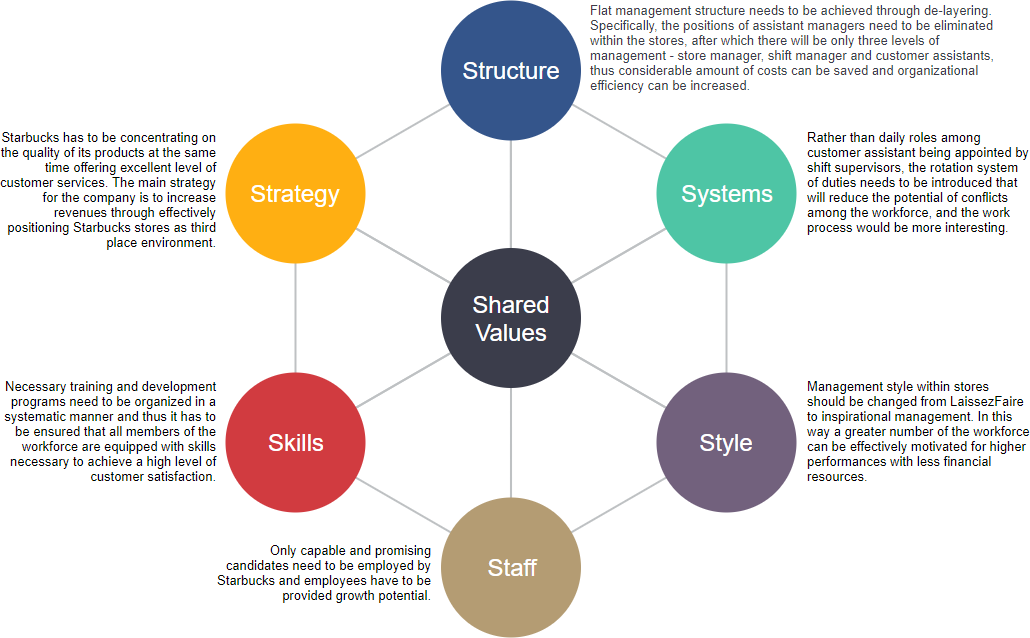
Edit this McKinsey 7S framework example
11. Ohmae’s 3C Model
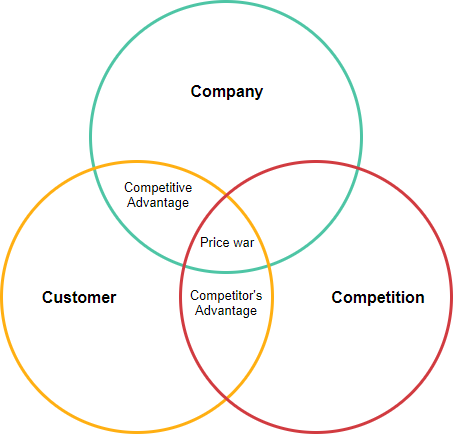
Kenichi Ohmae developed his ‘3C’s Model’ so that success over competitors could be achieved by focusing on three key components. According to Ohmae, the three key players in any business strategy are customers, competitors, and corporations. By bringing these together in a winning strategy your organization should find the ‘best’ market sector for success.
Corporation
First of all, the correct segmentation of the market is necessary, allowing to concentrate efforts on meeting the needs of one or several groups of clients. For example:
- What are our competencies (what are we good at?)
- What are our aspirations (what do we want to do?)
- What resources do we have?
Customers
The company’s strategy should be aimed at maximizing competitive advantages in functional areas that are key to achieving success in the industry, for example:
- Who are the customers in the market? (on a segment basis — might be by vertical, function, geography, company size or another parameter)
- What are the needs of various customers? (again, this is on a segment basis)
- How do they buy? (segment)
- How much do they buy? (ultimately, your market has to be big enough to support your company in achieving its growth goals)
Competitors
To create strategies aimed at competitors, you need to look for any differences in all corporate functions from purchasing and development to sales and service. The differences found must be evaluated about all the elements determining the profit (price, volume, costs).
- What are competitors offering (and not offering) that your customers need?
- What can competitors not easily offer that you might offer?
- How do competitors go to market (sell, service, market) that does not connect well with customers?
The 3 Cs in the model are Company, Customer, and Competitor. At the intersection of these 3 things is a good strategy: