Template Description
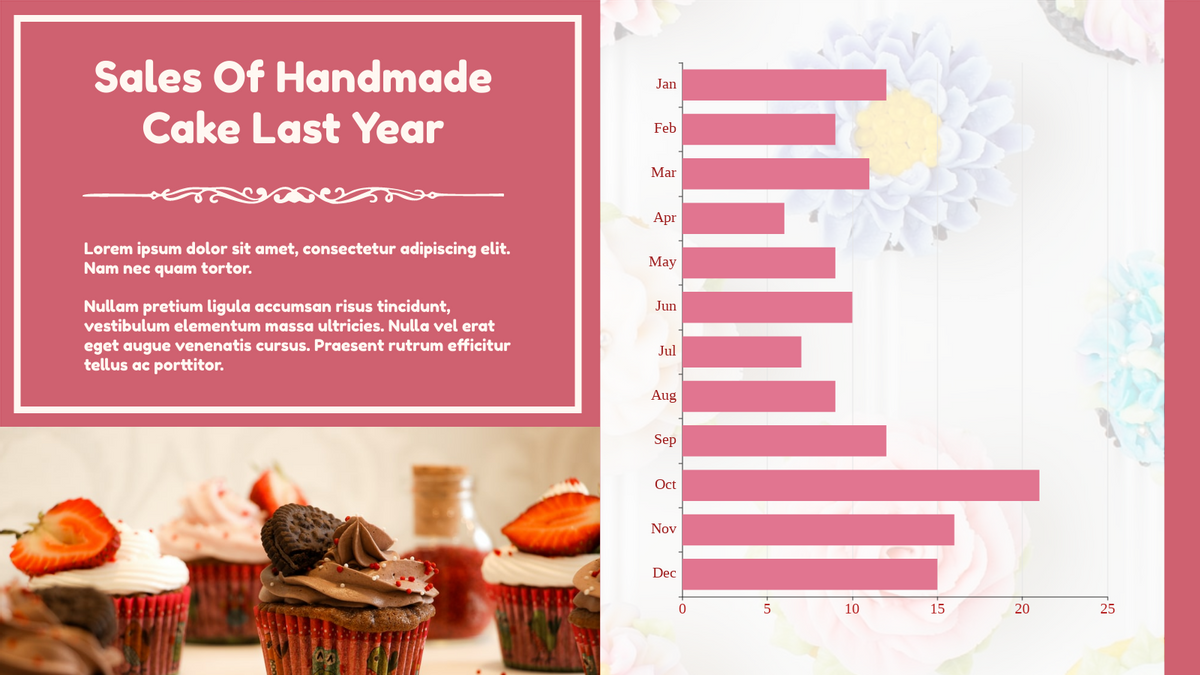
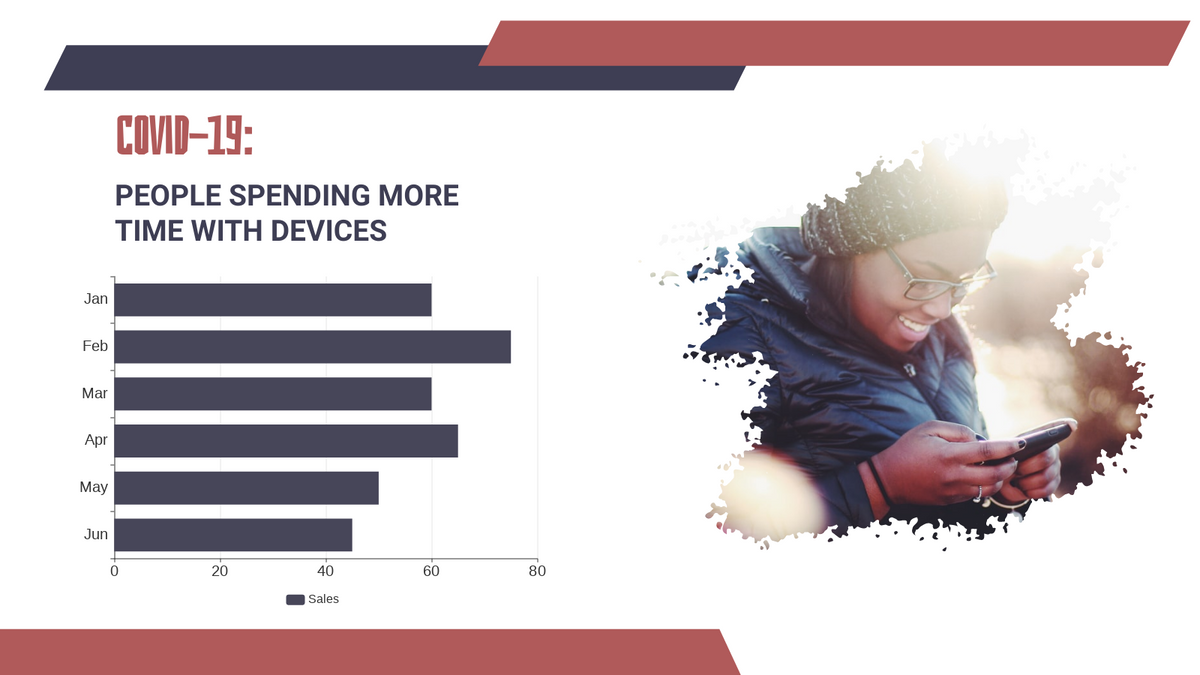
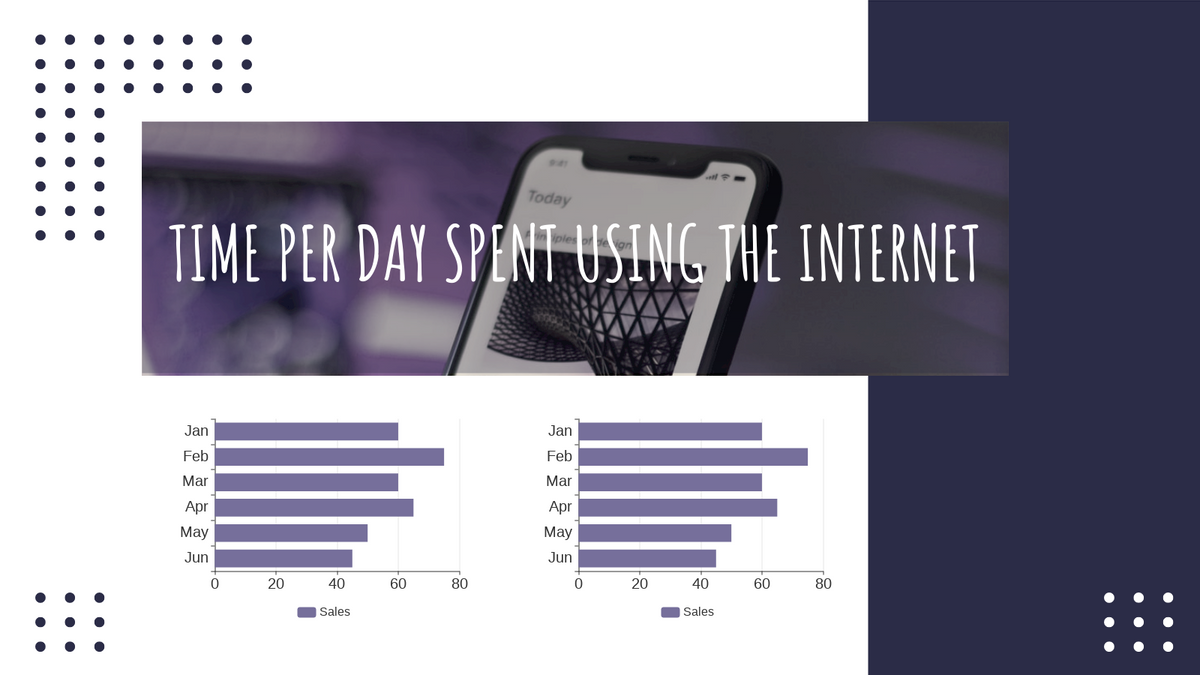
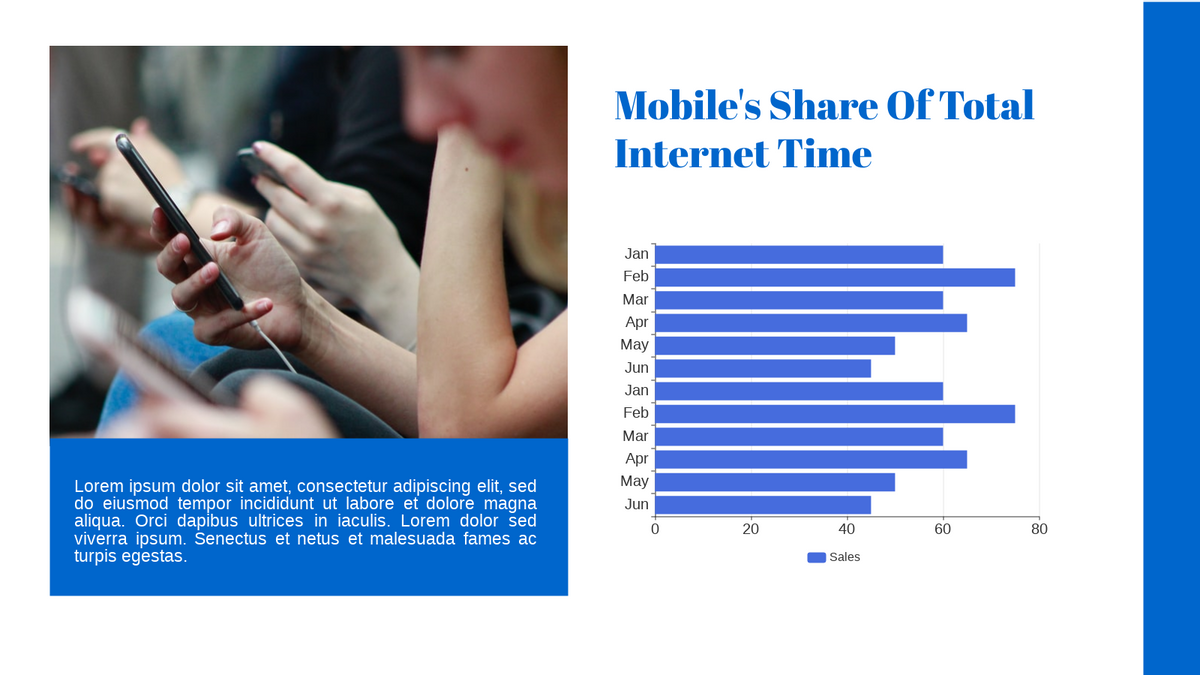
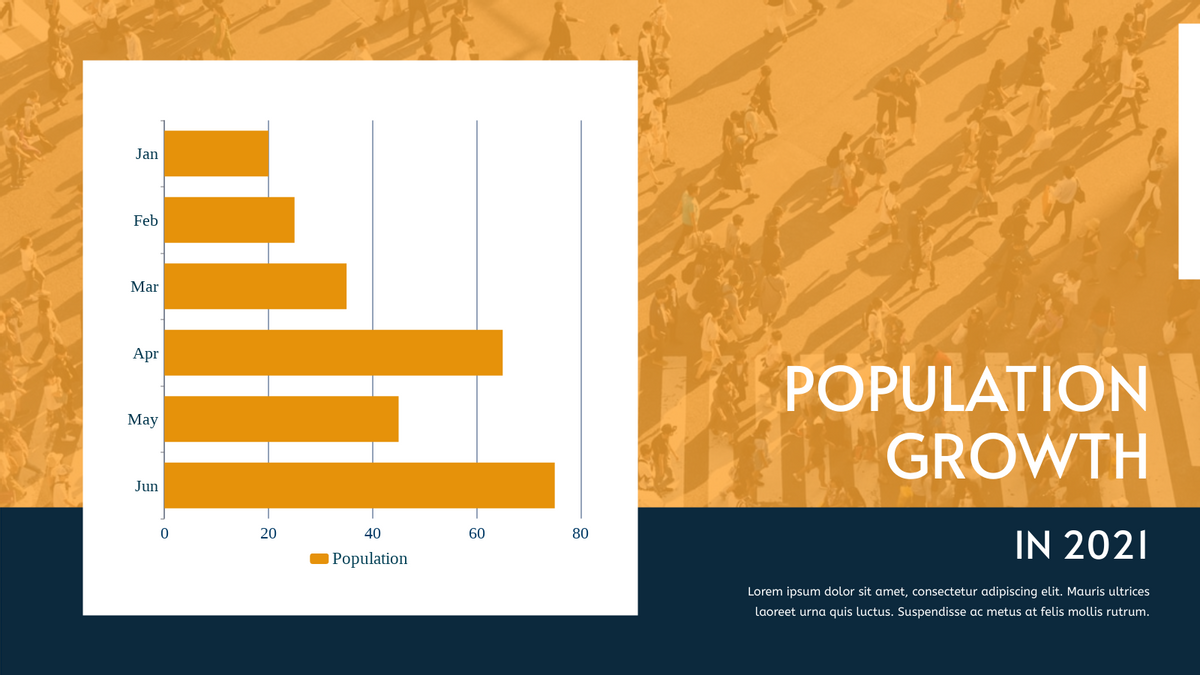
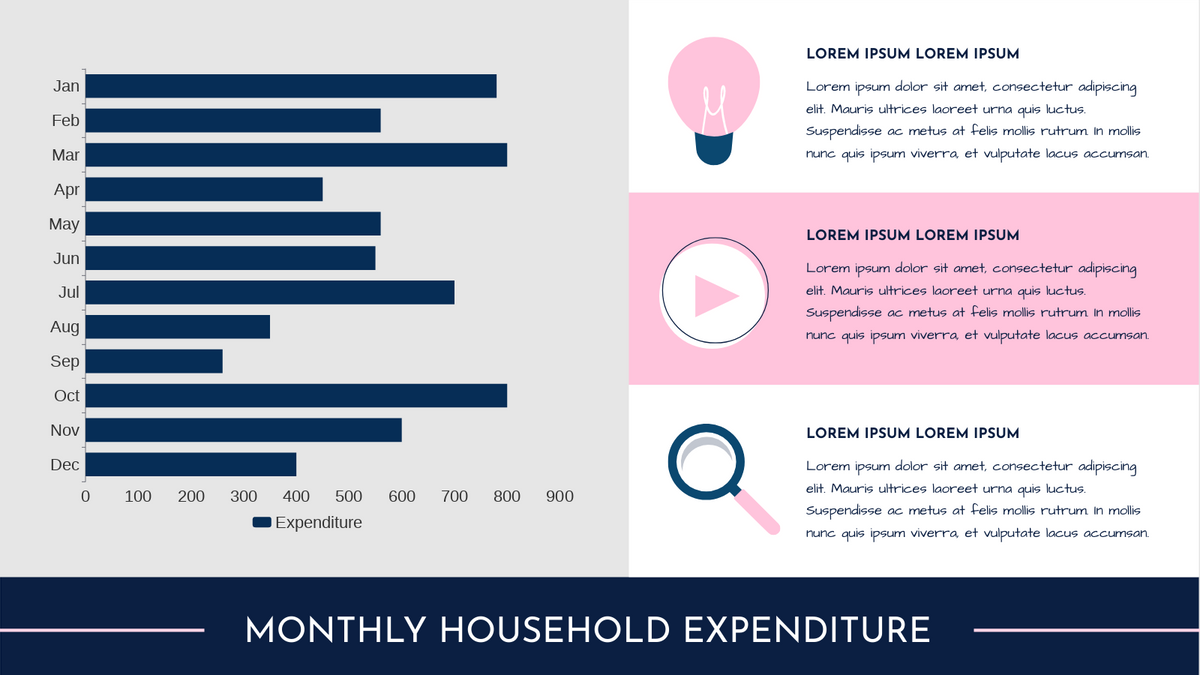
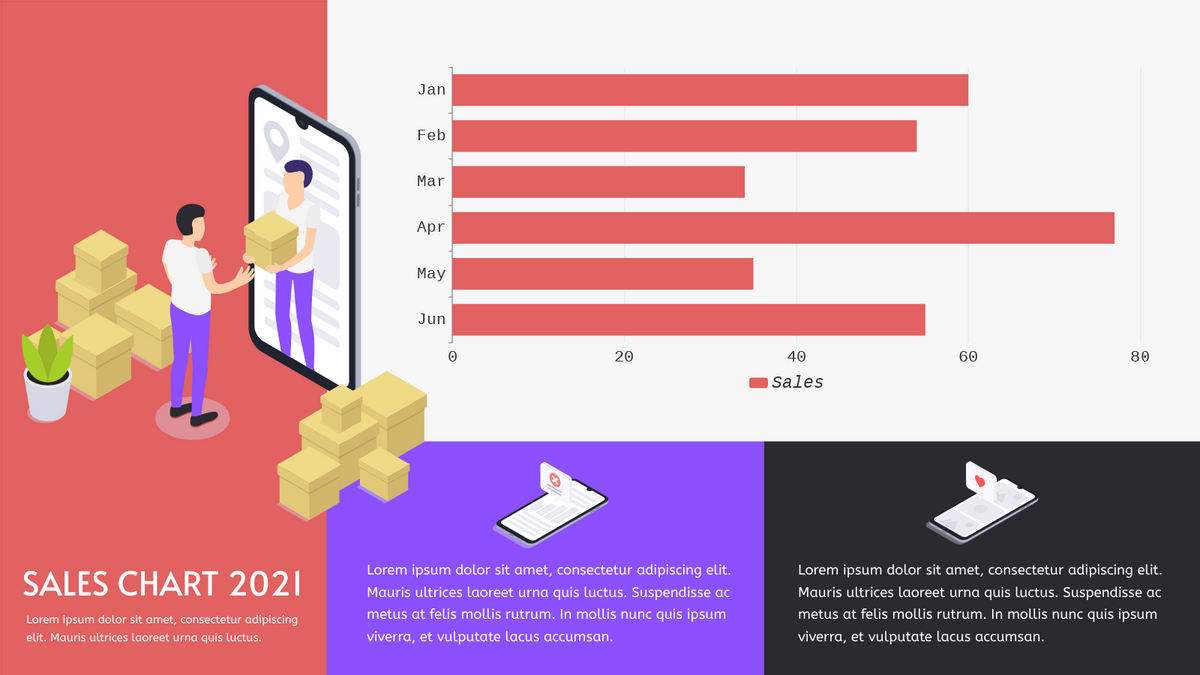
This beautifully designed infographic template showcases the sales performance of handmade cakes over the past year. The template features a charming and elegant style, with a bar chart that visually represents monthly sales data. The soft color palette and floral background add a touch of sophistication, making it perfect for businesses in the bakery and confectionery industry.
Customize Your Chart
Ready to create your own stunning infographic? Try our user-friendly chart maker tool today! With Visual Paradigm Online, you can easily edit this template to fit your data and customize the design to match your brand. No sign-up is required—simply click the "Edit" button to get started and bring your data to life with beautiful charts and infographics.
