ウェブベースのベン図ソフトウェアで美しいベン図を簡単に作成
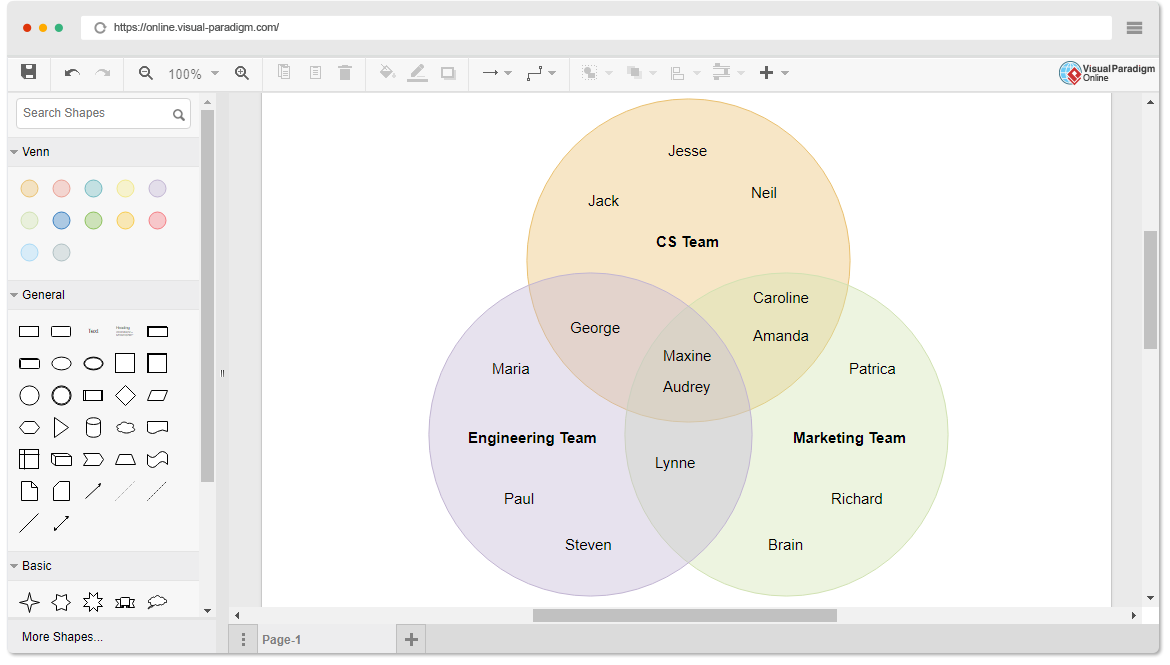
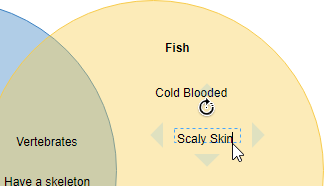
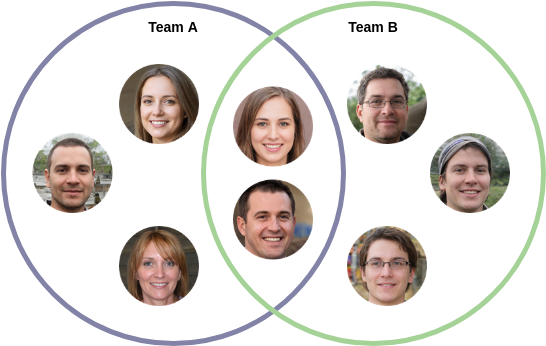
円の中に点を追加するのは簡単です。円の境界内をダブルクリックしてテキストラベルを作成し、名前を入力するだけです!これにより、素早く簡単にベン図を作成することができます。
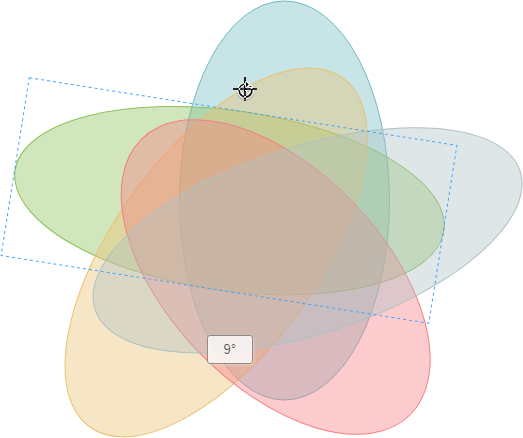
ベン図内のすべての図形は、自由に回転、移動、サイズ変更ができます。このため、円や点の外観を文脈に合わせてコントロールすることができ、伝えたいメッセージを伝えるのに役立ちます。
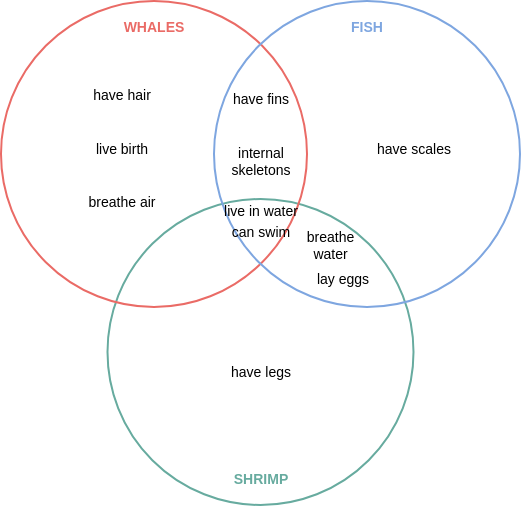
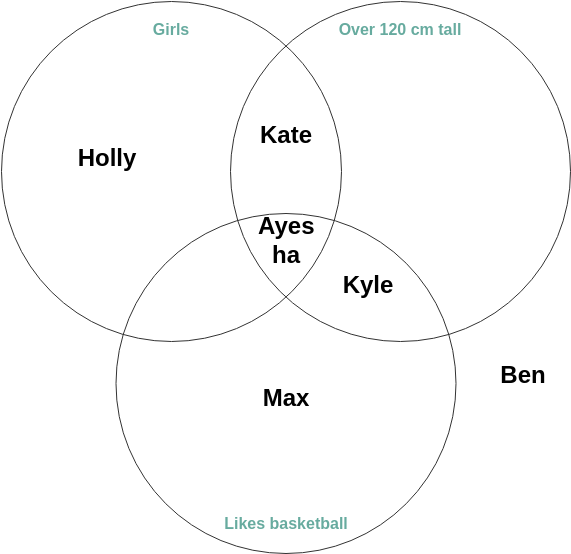
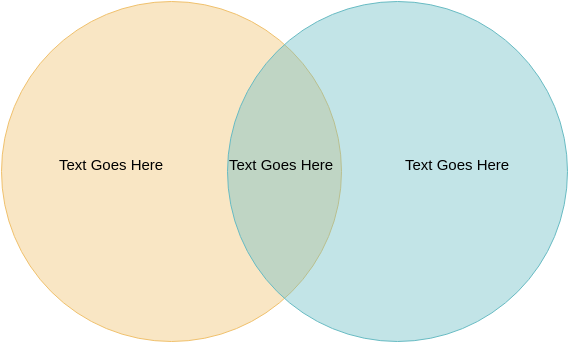
ヴェン・ダイアグラムは、プライマリー・ダイアグラム、ロジック・ダイアグラム、セット・ダイアグラムとも呼ばれ、2つ以上のデータ・セット間の論理的関係を表すために、数学、統計学、論理学、コンピュータ・サイエンス、ビジネス分析で広く使用されています。ベン図は、物事がどのように整理されているか、それらの共通点と相違点を示す、重なり合った円を含んでいます。Visual Paradigm のオンライン・ベン図エディタで、ベン図を描くことができます。
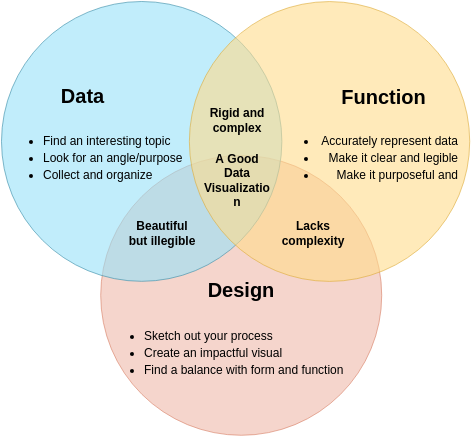
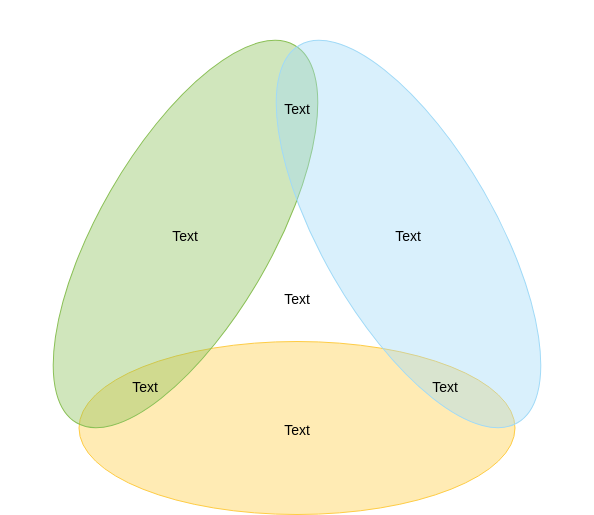
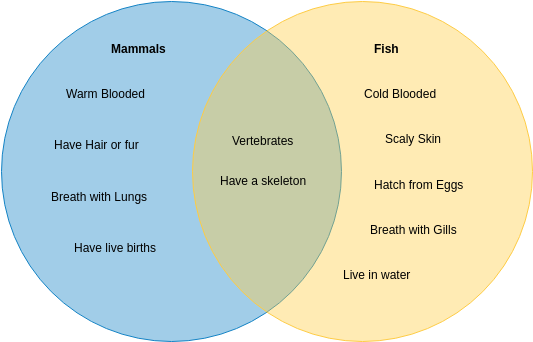
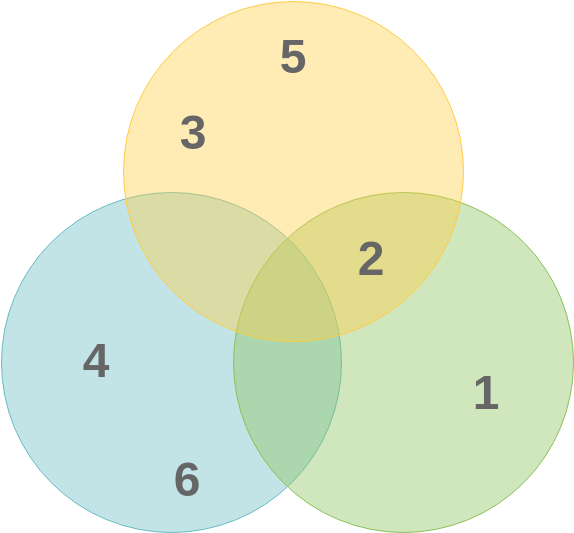
インスピレーションが必要ですか?私たちは、あなたが始めるのに役立ついくつかのベン図の例を以下にまとめました。図をクリックして表示するか、編集ボタンをクリックして編集を開始してください。
もっとお探しですか?よろしい。VP Onlineには、ベン図を簡単に描くのに必要なシンプルで高度なツールがすべて揃っています。

ドラッグひとつで図形やコネクタを作成できます。アライメント・ガイドを使えば、ドラッグの際に図形を正確に配置できます。
静的な画像をコピー&ペーストする代わりに、MSアプリケーションにインタラクティブなベン図を埋め込むことができます。Word、PowerPoint、OneNote、Outlookがサポートされています。

インポート機能により、Visio ステンシル (.vssx、.vsdx) を図面で使用できます。Visioの図面をVP Onlineにインポートし、編集を続けることができます。
図面を印刷したり、画像(PNG、JPG、SVG、GIF)やPDFにエクスポートして、他のユーザーと共有できます。
画像形式(SVG、JPG、PNGなど)でステンシルからなるパレットを作成し、デザインに使用できます。
チームメンバーは、共同で同時に描くことができます。他の人の作業を台無しにすることなく、同じ図を編集することもできます。


