Cree fácilmente hermosos Diagramas de Venn con el software de Diagramas de Venn basado en la web
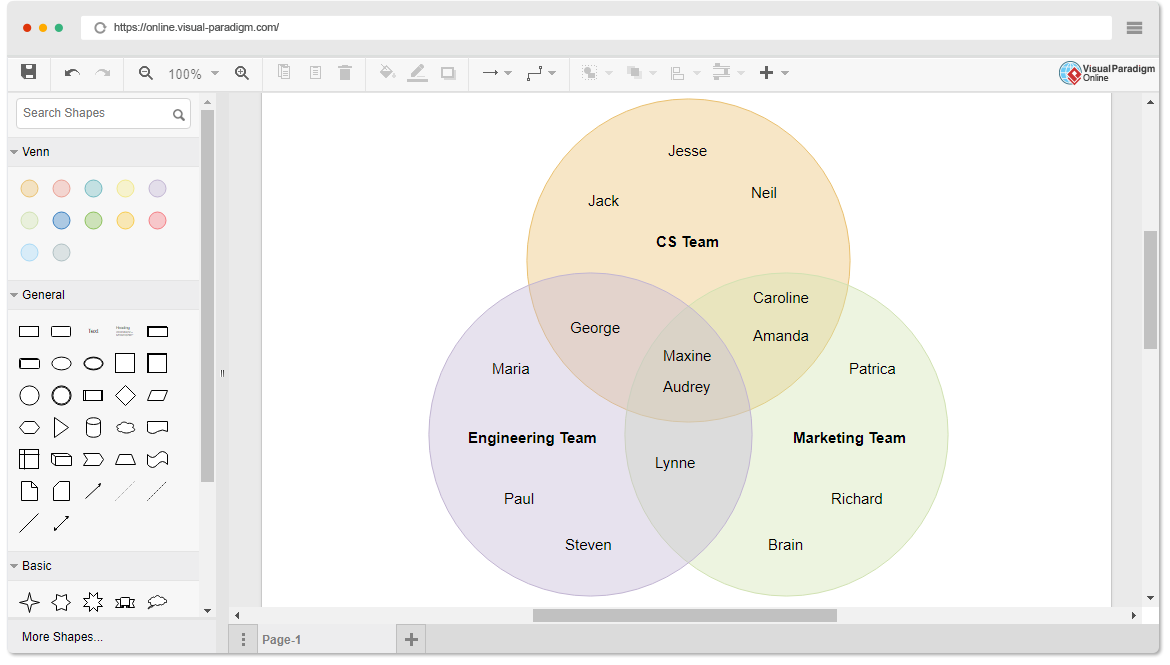
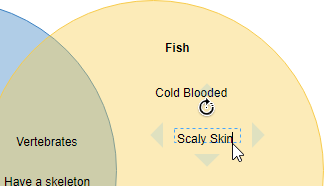
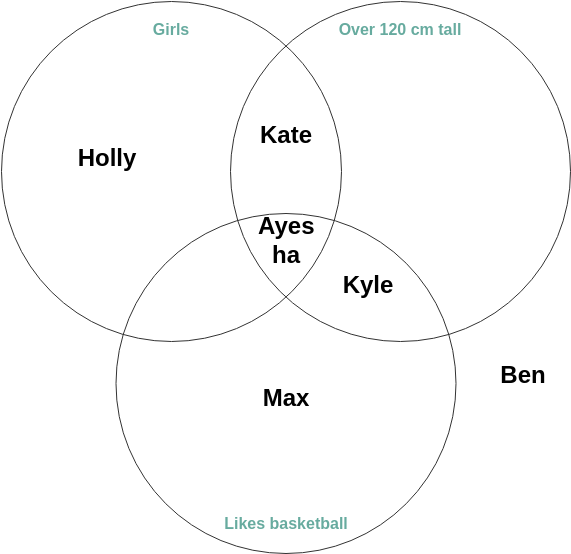
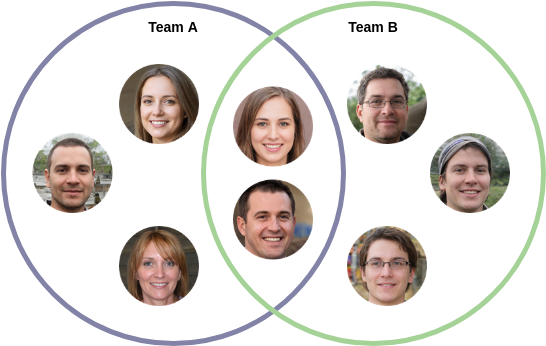
Añadir puntos a círculos es muy sencillo. Basta con hacer doble clic dentro de los límites de un círculo para crear una etiqueta de texto, introducir el nombre y ¡listo! Esto le permite formar un diagrama de Venn de forma rápida y sencilla.
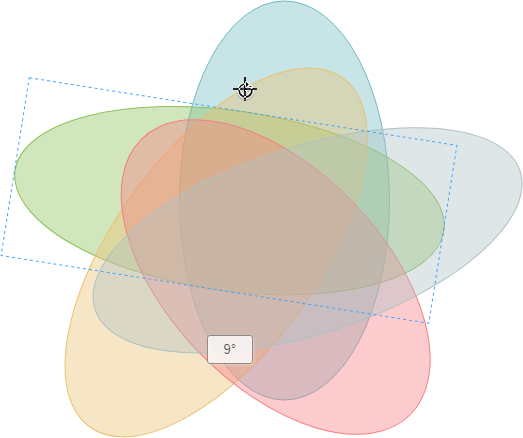
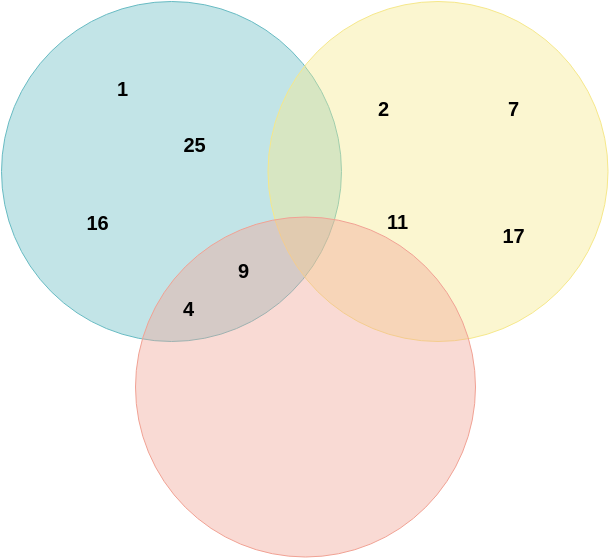
Todas las formas de un diagrama de Venn se pueden girar, mover y redimensionar libremente. Esto te permite controlar la apariencia de los círculos y puntos de forma que se ajusten a tu contexto y te ayuden a transmitir el mensaje que quieres transmitir.
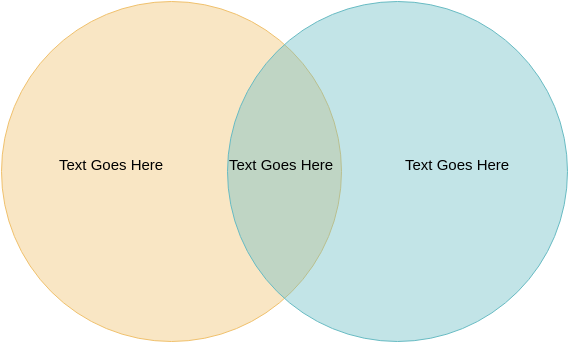
El Diagrama de Venn, también llamado Diagrama Primario, Diagrama Lógico o Diagrama de Conjunto, es ampliamente utilizado en matemáticas, estadística, lógica, informática y análisis de negocio para representar las relaciones lógicas entre dos o más conjuntos de datos. Un Diagrama de Venn implica círculos superpuestos, que presentan cómo se organizan las cosas, sus puntos en común y sus diferencias. Ahora puedes dibujar Diagramas de Venn con el editor online de Diagramas de Venn de Visual Paradigm.
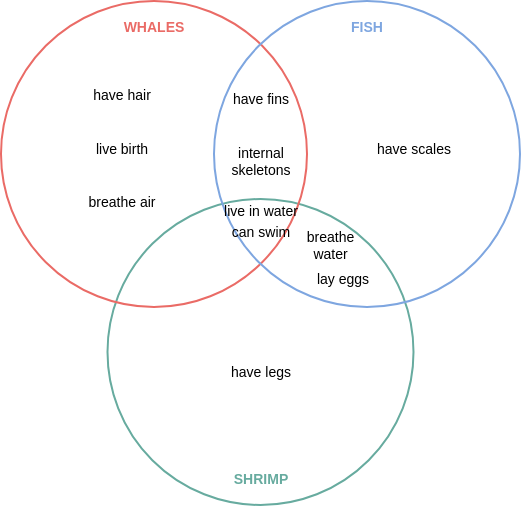
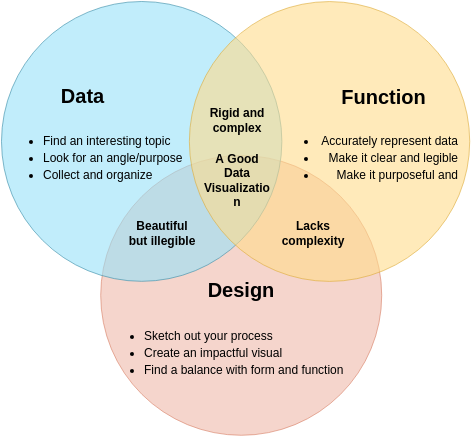
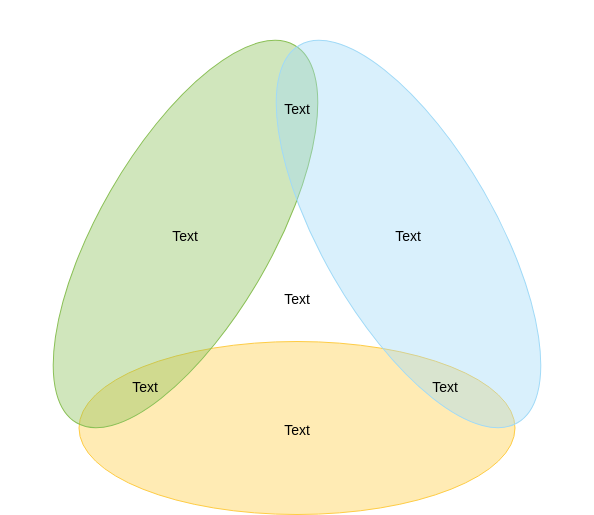
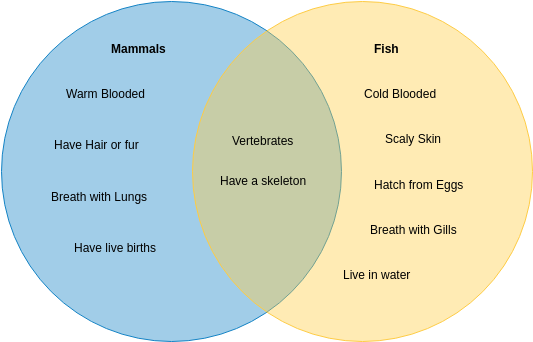
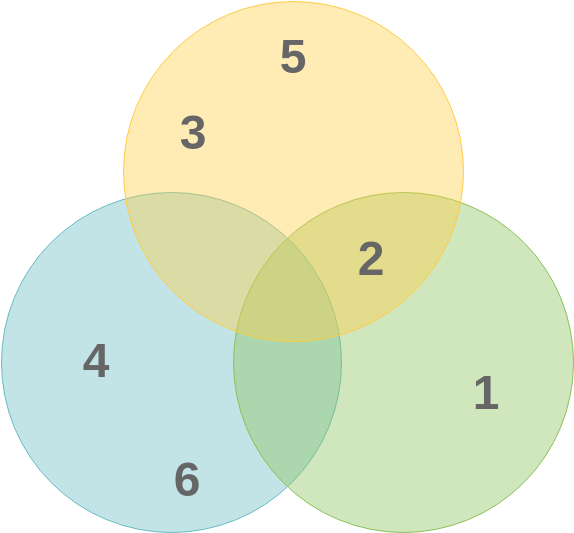
¿Necesitas inspiración? Hemos reunido algunos ejemplos de Diagramas de Venn a continuación para ayudarte a empezar. Haz clic en un diagrama para verlo, o haz clic en el botón de edición para empezar a editarlo.
¿Buscas más? Bien. VP Online tiene todas las herramientas simples y avanzadas que necesitas para dibujar diagramas de Venn fácilmente.

Crea formas y conectores con sólo arrastrarlos. Utilice la guía de alineación para colocar las formas con precisión al arrastrarlas.
En lugar de copiar y pegar imágenes estáticas, incrusta diagramas de Venn interactivos en las aplicaciones de MS. Word, PowerPoint, OneNote y Outlook son compatibles.

Utilice plantillas de Visio (.vssx, .vsdx) en su dibujo mediante la función de importación. Importe su dibujo de Visio a VP Online y siga editándolo.
Comparta su trabajo con otros imprimiendo o exportando diagramas en imágenes (PNG, JPG, SVG, GIF) o PDF.
Cree una paleta con sus plantillas en formatos de imagen (por ejemplo, SVG, JPG, PNG, etc.) y utilícelas en su diseño.
Los miembros del equipo pueden dibujar en colaboración y simultáneamente. Incluso pueden editar en el mismo diagrama sin arruinar el trabajo de los demás.


