Let's introduce the BGC matrix for business analysis using a 4-quadrant model. So what is a BGC matrix?
BGC Matrix using Four Quadrant Model
The BCG Matrix (also known as the Market Growth Relative Market Share Matrix) was pioneered in 1970 by Bruce Henderson, a prominent American management scientist and founder of the Boston Consulting Group. It analyzes and determines the product structure of an enterprise by market growth rates (indicators that reflect market gravity) and market share (indicators that reflect the strength of the business).
Market Growth Rate includes sales growth, target market capacity, competitor strengths and profitability. The most important of these is the sales growth rate, which is a comprehensive indicator of market attractiveness. It is external factors that determine whether the product structure of an enterprise is reasonable.
Market Share includes market share, technology, equipment, capital utilization capacity and so on. Market share is the internal factor that determines the product structure of an enterprise, which directly reflects the competitive strength of an enterprise.
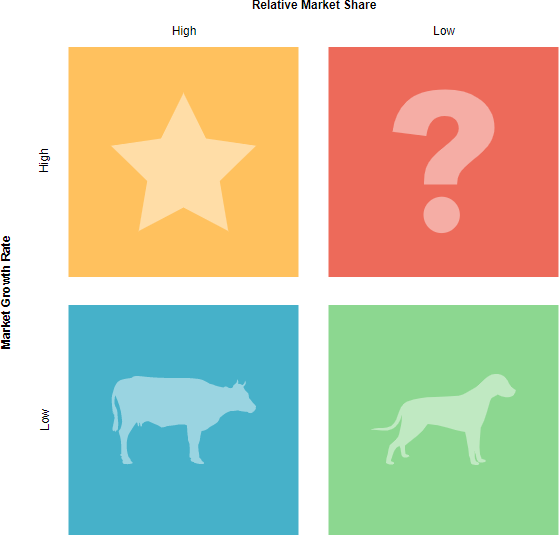
Structure of BGC Matrix
The matrix plots the company's products in a square matrix as shown below, with the Y axis representing the market growth rate and the X axis representing the market share. In other words, it presents product life cycle theory in a 2-by-2 matrix, assuming that market share is the primary success factor. This is ideal for long-term strategic planning, allowing you to review your products or services and decide whether they should be invested or discontinue.
Depending on your taste and design, you can choose the most suitable template for yourself. Try Visual Paradigm Online now it's FREE!


