GE McKinsey Matrix for Portfolio Analysis
The businesses now are becoming more vulnerable and competitive, requiring them to be more vigilant on their choice of investment which gives maximum results. The GE McKinsey matrix ensures the company to analyze its investment portfolio in a more systematic and precise manner.
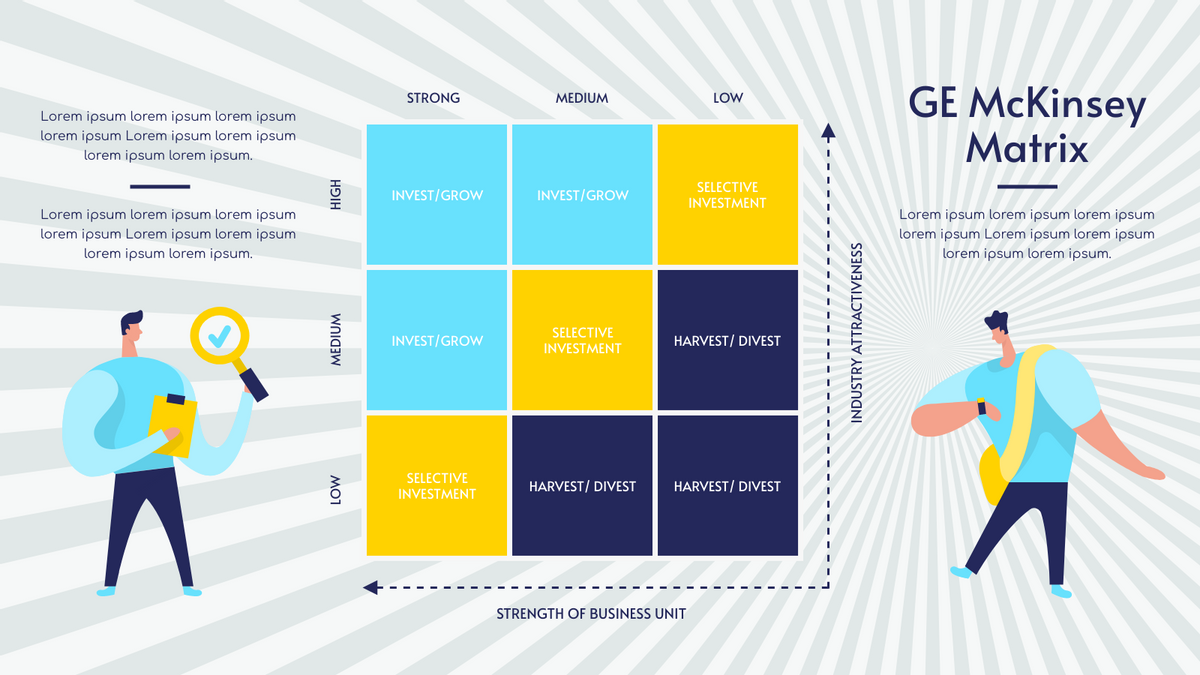
“The GE-McKinsey nine-box matrix is a strategy tool that offers a systematic approach for the multi-business corporation to prioritize its investments among its business units.”
The GE matrix helps corporations to evaluate their business portfolios and prioritize investments among their diversified units in a systematic manner. It consists of nine cells that map the strategic business units of the firm. It builds on two dimensions such as industry attractiveness and business competitive strength with different drivers. For example:
Drivers of Industry Attractiveness:
Market size
Market growth share
Competitive rivalry
Demand variability
Drivers of Competitive Strength:
Assets and competencies
Market share
Customer loyalty
Cost structure
Cash flow
GE McKinsey Matrix Template
Here is a GE McKinsey Matrix template created with Visual Paradigm's strategic analysis tool. You can customize this template by modifying the text, color, clipart, etc.


