Venn diagrams are graphical or pictorial representations of relationships between different groups of things. Venn Diagram was invented by John Venn around 1880. Venn diagrams are also called set diagrams. Venn diagrams give a logical representation of the groups or sets. Relationships between two or three sets can be easily understood with the help of Venn diagrams.
Guideline for creating Venn Diagrams
- Venn diagrams are most useful for showing relationships between two or more topics or things. The topics must be in some way related or comparable or they are not suitable for a Venn diagram model.
- A Venn diagram is primarily a visual model, it does not necessarily replace note-taking, and it is often not suitable for very large amounts of information.
- Don’t be afraid to think outside the circles. The space outside both circles is for that other topic that for one reason or another does not fit into either circle.
2 Circle Venn Diagrams
Venn diagrams use circles to represent sets and to illustrate the relationship between a finite collection of different sets. In mathematics, Venn diagrams are used to analyze known information obtained from surveys, data reports, and tables that consists of multiple overlapping closed curves, usually circles, each representing a set.
For example:
- Set of natural numbers = {1,2,3,…..}
- Set of whole numbers = {0,1,2,3,…..}
- Each object is called an element of the set.
The following examples show the basic operations of set in relating to Venn Diagrams.
| Set Basic Operations | Venn Diagram |
| The intersection of two sets A ∩B = is the number of elements present in both the sets A and B. |  |
| Union of two sets A U B = is the number of elements present in either of the sets A or B. |  |
| Symmetric difference of two |  |
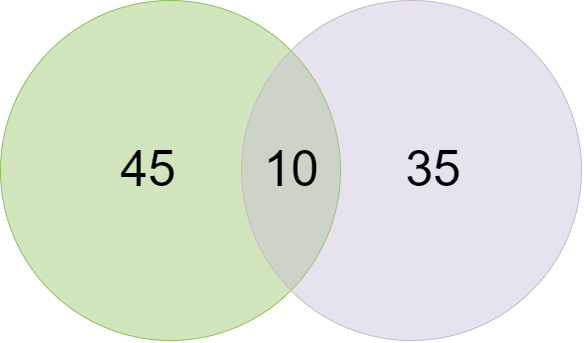
Venn Example: Class of Students
In a class of 100 students, 35 like science and 45 like math. 10 like both. How many like either of them and how many like neither?
- Total number of students, n(µ) = 100
- Number of science students, n(S) = 35
- Number of math students, n(M) = 45
- Number of students who like both, n(M∩S) = 10
- Number of students who like either of them,
- n(MᴜS) = n(M) + n(S) – n(M∩S)
- → 45+35-10 = 70
- Number of students who like neither = n(µ) – n(MᴜS) = 100 – 70 = 30
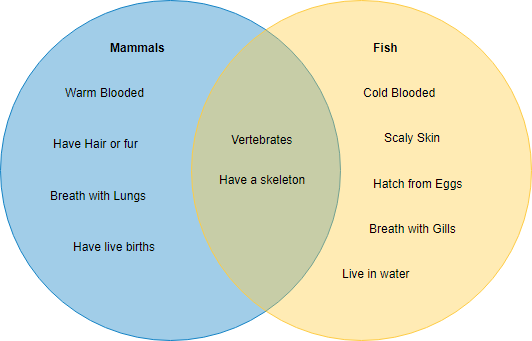
Venn Diagram Example: Mammals and Fish
This is a Venn diagram example that shows the characteristics of mammals and fish, which are grouped as two ovals. The characteristics that are in common are placed inside the overlapping region of the two ovals.
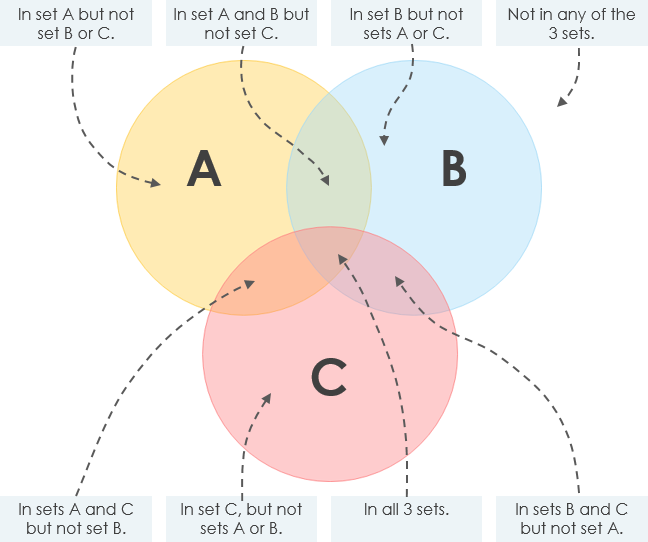
Three Circle Venn Diagram
A 3 Circle Venn diagram is a way of classifying groups of objects with the same properties.
- It has three circles that intersect each other.
- Each circle has its own set of properties of things that go into the circle, e.g. odd numbers or shapes with right angles.
- There is also a space outside the circles where objects that do not fit any of the properties can go.
- The diagram below shows you how a Venn diagram with 3 circles works.
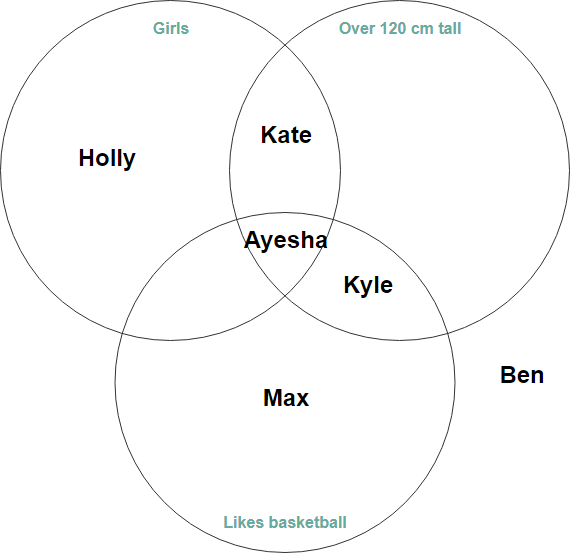
The following example illustrates the concept of the set above.
| Ben | Ayesha | Kate | Max | Kyle | Holly | |
|---|---|---|---|---|---|---|
| Boy/Girl | boy | girl | girl | boy | boy | girl |
| Age | 7 | 9 | 8 | 6 | 8 | 8 |
| Height (cm) | 116 | 132 | 135 | 114 | 121 | 119 |
| Likes basket | no | yes | no | yes | yes | no |
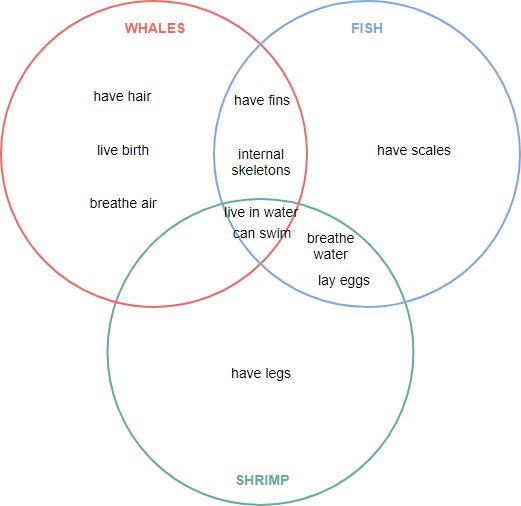
3 Circle Venn Diagram Example – Aquatic Creatures
By extending the example above, this Venn diagram uses to show relationships among aquatic life-forms: whales (mammals) and fish, shrimp (aquatic creatures). In the various fields are characteristic of the aquatic creatures. In the overlaps, the creatures share properties; outside the overlaps, the creatures have different properties.