What is a Data Flow Diagram?
A data flow diagram can help you understand the data being used by a system, and their flows. This is a data flow diagram guide that provides everything you need to know about data diagrams. You will know the definition of DFD, the DFD symbols and notations, and how to create a DFD. Besides, you will learn the different levels of DFDs (context, level 1, etc), the difference between a logical and physical data model, and more.
It's easy to understand the flow of data through systems with the right data flow diagram software. This guide provides everything you need to know about data flow diagrams, including definitions, history, and symbols and notations. You'll learn the different levels of a DFD, the difference between a logical and a physical DFD, and tips for making a DFD.
What is a data flow diagram?
DFD, short for Data Flow Diagram, is a visualization of the information flow of a process or system. It uses simple symbols like rectangles, circles and connectors to represent the processes, data stores, and direction of data flow.
Data flow diagrams can be created as simple process overview, or as multi-level DFDs that expand a process from a higher level to finer levels of process details.
Edit this DFD with our DFD maker
When to create a data flow diagram?
Data flow diagrams are useful both to analyze the information flow of an existing system, and to model a new system. The use of simple symbols make DFD easily understood by both technical and non-technical people. Note that although DFDs are popular and they work well for data-driven IT systems, they are less applicable to model real-time software systems.
History of the DFD
The DFD notation is derived from graph theory, which was originally used in operations research to model organizational workflow. DFD originated from the activity diagrams used in the structured analysis and design technique methodology in the late 1970s. Popularizers of DFD include Edward Yourdon, Larry Constantine, Tom DeMarco, Chris Gane and Trish Sarson.
DFD quickly became a popular way to visualize the data flow involved in software-system processes. DFDs were usually used to show data flow in a computer system, while they could also be applied to business process modeling. DFDs were useful to document the major data flows or to explore a new high-level design in terms of data flow.
DFDs Symbols and Notations
There are mainly three types of DFD symbols, which are named after their creators:
· Yourdon and Coad
Edit this Yourdon and Coad DFD
· Yourdon and DeMarco
Edit this Yourdon and DeMarco DFD
· Gane and Sarson
Edit this Gane Sarson DFD Example
Yourdon-Coad and Yourdon-DeMarco use circles to represent processes, while Gane and Sarson use rounded rectangles.
Listed below are the DFD symbols typically used:
Entities: People, organizations, or other things that interact with the system, i.e. entities are “outside of the system,” that is they are part of a process, but external to the information system. They send or consume information, and in Gane-Sarson notation are also called sources or sinks of information. If the same entity is shown more than once in a diagram, a diagonal line is added to the lower right-hand corner to visually distinguish it.
Process: The actions that directly change the data. Whenever an action takes place, a new output is formed based on that action. Typical processes include calculations, data sorting or set of specific rules that a business may follow.
· The Process Should Be Named Or Described With A Single Word (A Verb), Phrase, Or Simple Sentence That Describes What The Process Does.
· Similar To Other Notations, A Good Name Will Generally Consist Of A Verb-Object Phrase Such As Check Availability.
· In Some Cases, The Processes Are Named For A Role, An Organization, Or A Machine That Performs The Process.
· Processes Are Given A Number In The Upper Right-Hand Corner; This Is An Identifier And Does Not Imply Sequence.
Data flow:The lines with arrows that are used to mark where the data flows. As external entities create processes and interact with data stores, data flow lines map out these inputs and outputs. Data flow lines are an essential aspect of a data flow diagram as they tie all of the information together. They are also marked with labels that briefly define what each data flow is accomplishing.
· Gane Sarson Notation Uses Straight Arrows.
· Arrows Should Be Named To Indicate The Meaning Of The Data That Moves Along The Flow That Is, A Noun.
· Data Flows With A Verb Name Signify A Process That Has Been Omitted. Data Flow In And Out Of A Process Must Be Altered In Some Way.
Datastore: Files or storage areas that contain information that can be called on at a later date. They typically appear as database tables or spreadsheets. Like processes, data stores receive simple labels explaining their purpose or order.
· The Datastore Is Used To Model A Collection Of Data At Rest.
· Datastores Can Be In Computerized Or Non-Computerized Forms, Such As Paper Charts, Microfiche, Index Cards, Etc.
· Stores Are Passive; Processes Put Data In Or Read Data.
· Like Processes, Data Stores Can Be Given An Identifying Number, E.G., D1, D2, Etc., Where “D” Denotes A DataStore And The Number Serves As A Unique Identifier.
· Like Entities, Data Stores Can Be Drawn More Than Once On A Diagram.
DFD in multi-levels
Data flow diagram can be “expanded” into deeper levels to reveal more details. DFD levels are numbered 0, 1, 2, and so forth. The top-level DFD is called the level 0 DFD, or simply the context DFD, or context diagram.
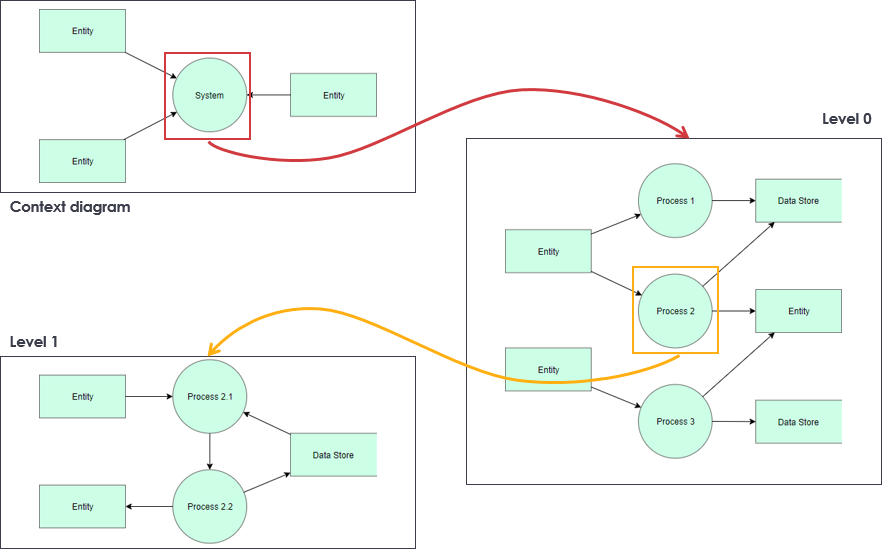
Level 0 DFD, aka Context Diagram, is the overview of the system or process. It shows the system as one single high-level process, with its relationships to the external entities, and does not possess any data stores. Level 0 DFD is very simple and can be easily understood by both technical and non-technical people, such as business analysts, system analysts, developers, and even the stakeholders.
Level 1 DFD is a drill-down of a level 0 DFD. From a level 1 DFD. You can see the major processes involved in a system, a high-level data flow between processes, data stores, and entities.
Level 2 DFD is an expansion of level 1 DFD, which breaks down processes in higher level to system functions.
The use of level 3 and 4 DFD is not wrong, but uncommon. Note that the more DFD levels created, the more complex your model can be.
DFD examples
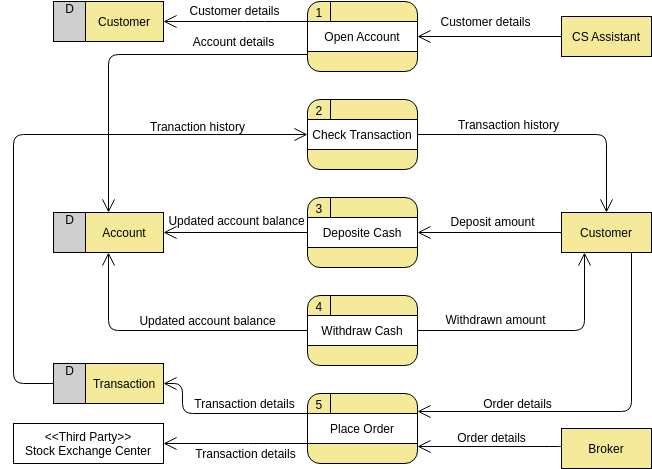
Data flow diagrams are widely used in the modeling of information systems. In this section, we collected some DFD examples for you as reference. You can create your own DFDs online with those examples, using Visual Paradigm Online.
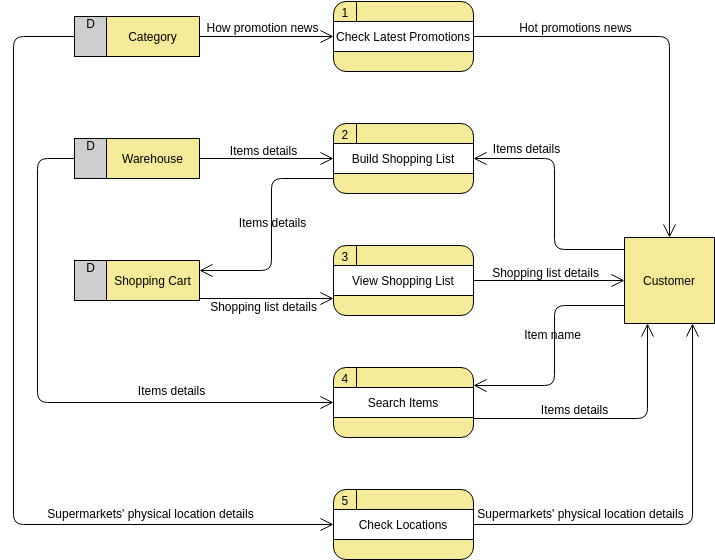
DFD for a supermarket app: (Edit this Data Flow Diagram with Visual Paradigm Online's DFD maker.)
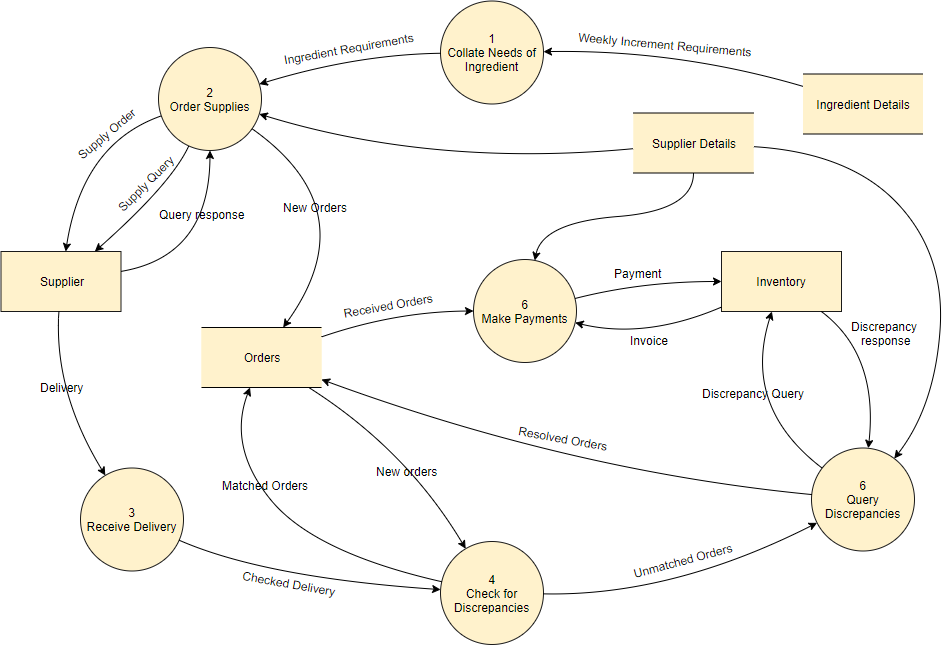
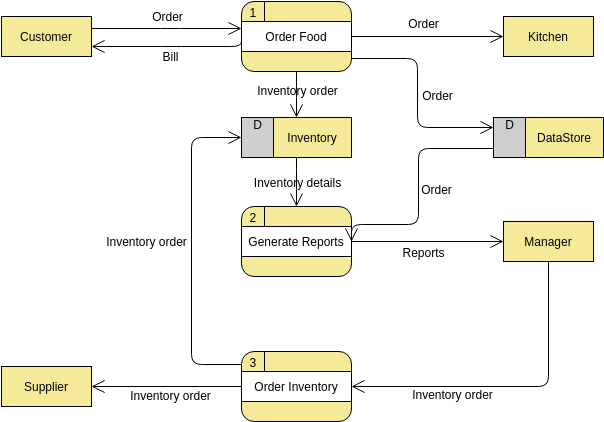
DFD example: Food ordering system (Edit this DFD)
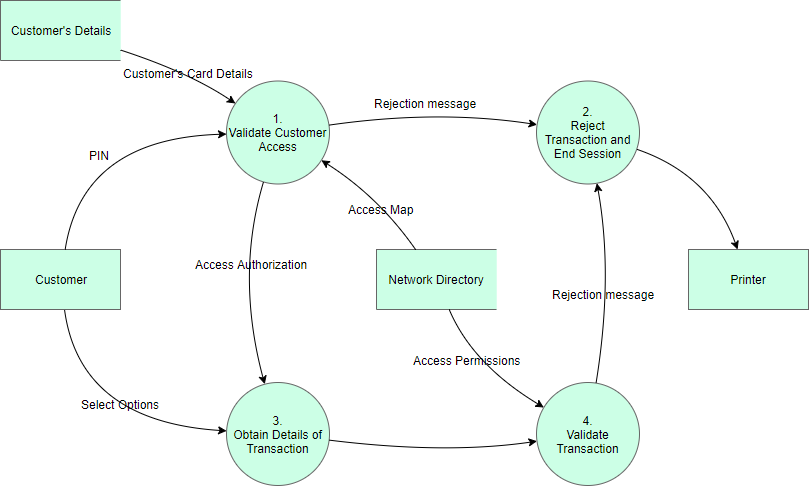
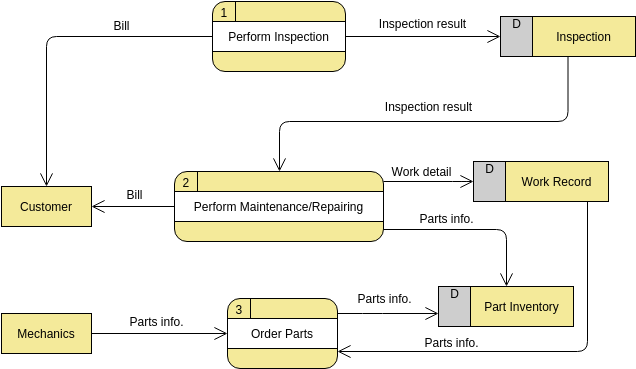
Data flow diagram example: Vehicle maintenance depot (Edit now)
How to make a data flow diagram
You can create your own DFDs with Visual Paradigm’s online DFD maker. We provide you with a rich set of DFD symbols and DFD templates to visualize the flow of data through your system.
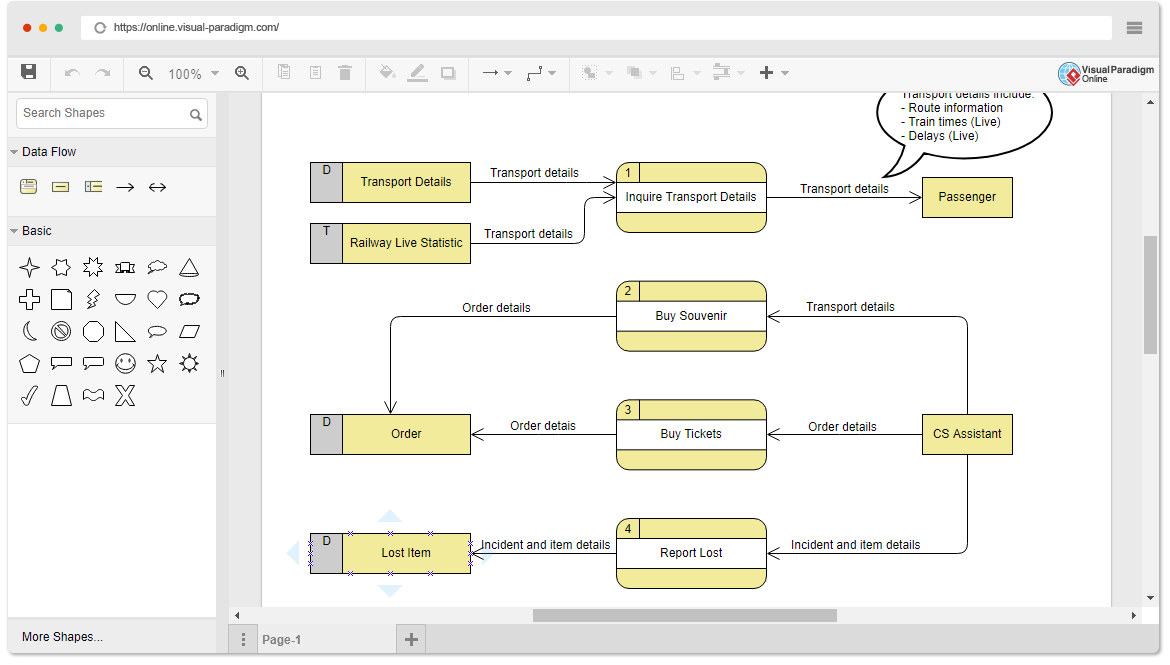
Want to make a DFD now? Try Visual Paradigm. Data flow diagramming is quick and easy with Visual Paradigm.