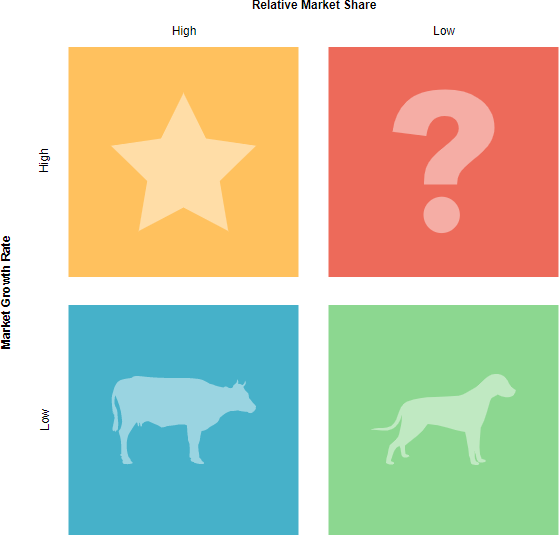
Boston Consulting Group has created the BCG matrix, also known as the Boston or Growth Share matrix, a planning tool that uses a graphical representation of a company's products and services to help it decide which products to keep, sell or invest in. Since 1968, the matrix has been used to help companies understand which products will best help them take advantage of market share growth opportunities.
The Elements of BCG Matrix
The BCG matrix plots the company's products in a 2 x 2 four quadrant matrix .
The Y-axis represents the market growth rate
The X axis represents the market share.
On BCG matrix, the vertical axis represents the sales growth rate of the enterprise, the horizontal axis represents the market share, The coordinate chart is divided into four quadrants, namely "question mark (?)" "Star", "cash cow", "thin dog" (×) ".
Its purpose is to make enterprises take different decisions through the division of different quadrants of products, so as to ensure that they constantly eliminate the products without development prospects, maintain the reasonable combination of "question mark", "Star" and "cash cow" products, and realize the virtuous circle of product and resource allocation structure.