Condition Process Flowchart
A condition process flowchart is a visual representation of a decision-making process. This flowchart outlines the steps involved in evaluating a condition and selecting the appropriate process to follow. The three steps in this condition process flowchart are Process A, Process B, and Process C.
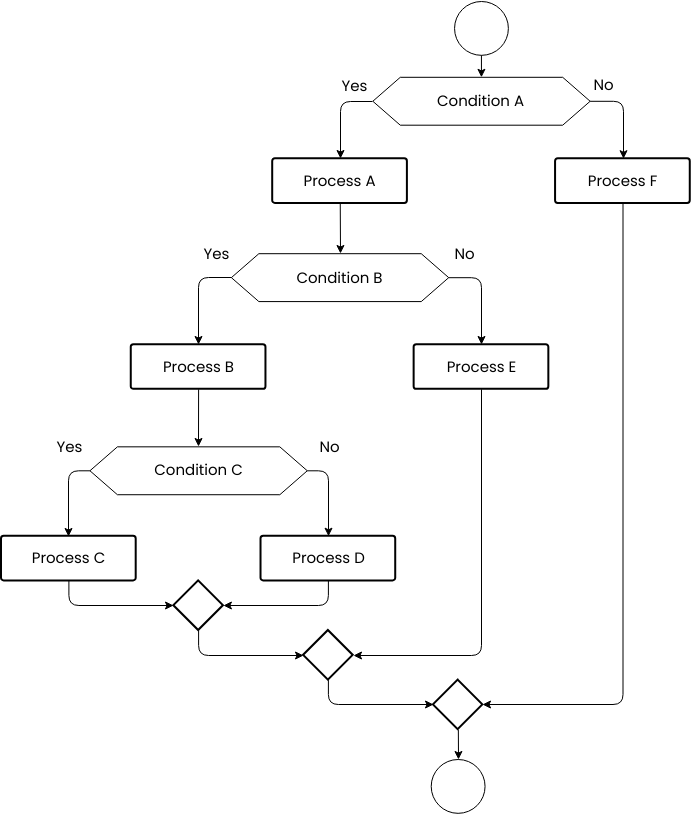
The first step in the condition process flowchart is Process A. This represents a decision point where a condition is evaluated, and a determination is made about which process to follow. If the condition is met, the process will proceed to Process B. If the condition is not met, the process will proceed to Process C.
Process B represents the process that will be followed if the condition evaluated in Process A is met. This could involve a variety of actions, such as data processing, calculations, or document generation. Once Process B has been completed, the process will proceed to Process C.
Process C represents the process that will be followed if the condition evaluated in Process A is not met. This could involve a different set of actions than Process B, such as error handling, logging, or exception handling. Once Process C has been completed, the process will end.
Overall, a condition process flowchart is an essential tool for decision-making processes. By following each step in the flowchart, organizations can ensure that conditions are evaluated, and appropriate actions are taken based on the outcome. It can help to improve decision-making, reduce errors, enhance communication, and ultimately contribute to the success of the organization.
What is it important to create a condition process flowchart?
Creating a condition process flowchart is important for organizations because it provides a standardized process for decision-making. When faced with complex decisions, it can be challenging to ensure that the right steps are taken in the right order. A condition process flowchart helps to break down the decision-making process into smaller, more manageable steps, ensuring that each step is clearly defined and understood.
By having a standardized process for decision-making, organizations can ensure that decisions are made consistently and efficiently, reducing the risk of errors or inefficiencies. This can help to improve communication among team members, as each person involved in the decision-making process will have a clear understanding of their role and responsibilities. Additionally, having a visual representation of the process can help to improve communication and reduce the risk of errors or miscommunications.
If you require templates for designing flowcharts, consider visiting Visual Paradigm Online. They offer a variety of customizable templates to choose from.


