使用 Visual Paradigm 简单易用的信息图表制作工具,在几分钟内就能创建精美的设计。InfoChart 是众多出色的设计功能之一,能让你将数据漂亮地可视化。只需拖动即可在设计中添加信息图表,并通过拖放调整数值。你还可以更改颜色、字体等设置。
容器 Template Specifications:
可定制的:
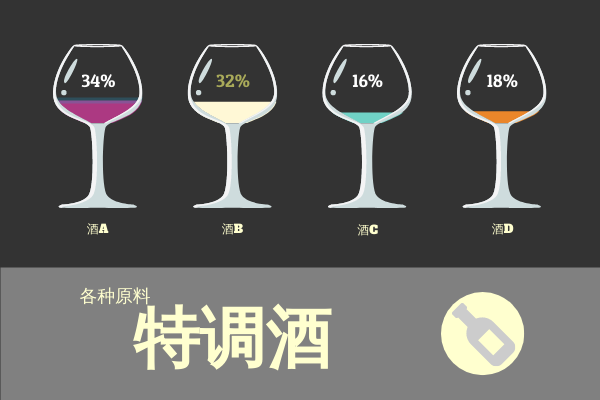
利用 Visual Paradigm 的在线图表模板(如图)吸引受众。下面的模板向你展示了如何使用 InfoChart 创建精美的设计。通过拖放替换你自己的数据。通过更改背景、颜色和字体来润饰设计。
Dominant Color
Palette
Dimension
600 x 400 px


