An information flow diagram (IFD) is an illustration of information flow throughout an organization. An IFD shows the relationship between external and internal information flows between organizations. It also shows the relationship between the internal departments, sub-systems, sub-systems.
Information Diagram at a Glance
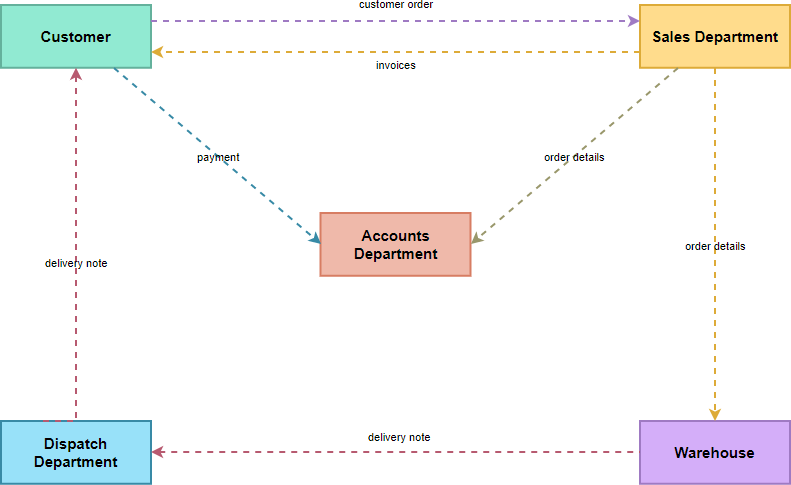
A customer needs to make an order. The customer first posts the order to the sales department. Customer’s order details are then entered into a centralized database which can only be accessed by the warehouse (to make up the order); the goods are handed to the dispatch department with a delivery note attached to them for delivery. On delivery, the customer receives the goods and the delivery note (which are handled by a member of the dispatch department). The sales department creates an invoice that is posted to the customer; the accounts department then assesses a copy of the invoice from the centralized database. The customer is then required to post the payment to the accounts department.
Edit this Information Flow Diagram
(*Source: Wikipedia – Information Flow Diagram)
When to Use Information Flow Diagram?
The concept of Information Flow Diagram was initially used in radio transmission which may consist of: feedback, a reply or response to the signal that was given out; the return paths can be two-way or bi-directional: information can flow back and forth. Examples of media include:
- word of mouth
- radio
- feedback
- a reply or response to the signal
- etc
The main purpose of an information flow diagram visualizes the forwarding of information and the analysis of different situations. It is a behavior diagram that shows the exchange of data between systems.
They are also used to describe the circulation of information within systems and typically used for the following cases:
- Develop a high-level overview of the flow of information in an organization.
- Highlight detailed flows in an individual task.
- Describe the flow of information inside and around organizations and between departments.
- Understand business process bottlenecks in sequential, deferred, real-time, parallel, wheel, one-to-many, many-to-many and many-to-one-to-many information flows.
Elements of Information Flow Diagram
Construction of an information flow diagram requires the knowledge of different information sources and the connections between them.
Edit this Information Flow Diagram Example
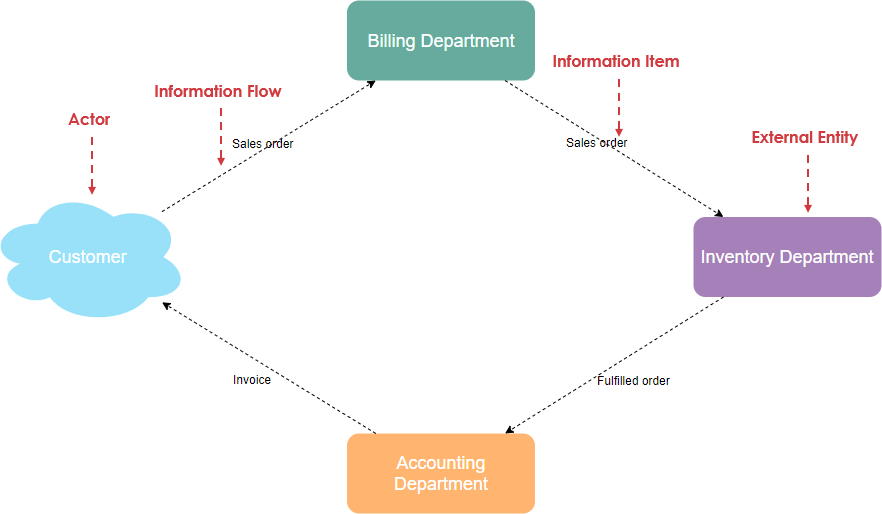
- The sources and targets of information flow are one of the following: actor, use case, node, artifact, class, component, port, property, interface, package, activity node, activity partition, or instance specification.
- A dashed line with an open arrow pointing away from the source to the target is used to represent information flow.
- The keyword “flow” may be written above or below the dashed line.
- Information items represent the abstraction of data and act as information flow connectors, representing the flow of transfer of information from source to target.
- Information items do not provide any detail of the information they transfer as they are featureless.
Information Flow Diagram vs Data Flow Diagram vs Flowchart
Information flow diagram s are often confused with data flow diagrams (DFDs).
- Information flow diagrams show information as sources, destination, and flows.
- DFDs show processes where inputs are transformed into outputs. Databases are also present in DFDs to show where data is held within the systems. In DFDs information destinations are called “sinks”.
- Flowcharts show the flow of control. In a flow chart, a reader can determine what operations will be performed, in what order, and under what circumstances.