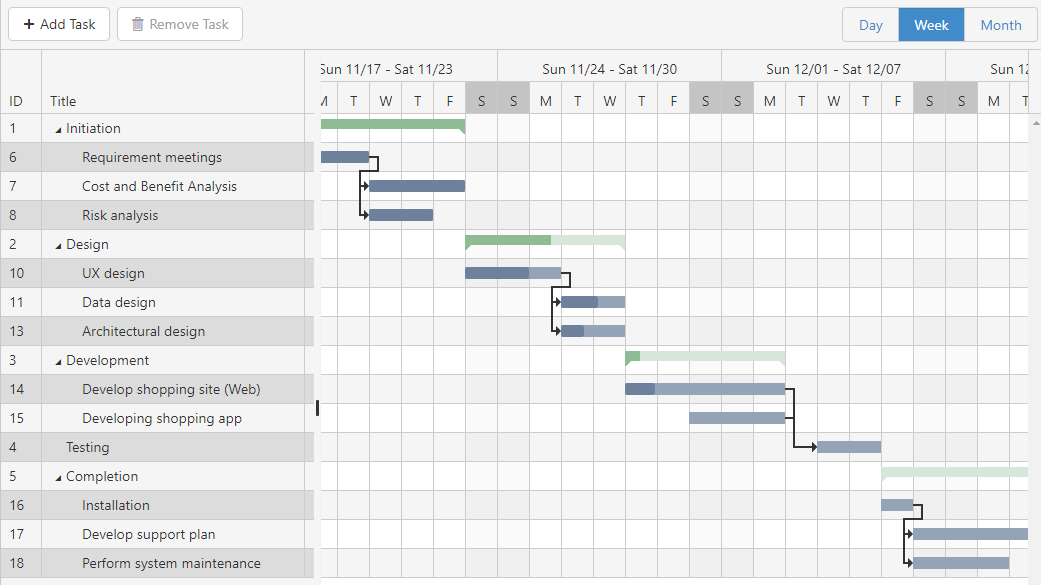
Gantt charts are graphical representations of task-based projects which enable you to schedule your work over some time. It can be useful for breaking down big pieces of work into a series of tasks and planning when to complete one. Gantt charts are the ideal tool to use if you are responsible for scheduling a project and tracking the duration of each of the tasks in the project to ensure the project is completed on time.
It is a kind of bar chart that shows the tasks of a project when each task must take place, and how long each task will take to complete. As the project progresses, the chart’s bars are shaded to show which tasks have been completed? People assigned to each task can also be represented on the chart by name or by color. Gantt charts are considered a project planning and management tool for the following purpose:
- Scheduling and monitoring tasks within a project
- The steps of the project or process, their sequence, and their duration are known
- Visualize which tasks depend on the completion of previous tasks
- Communicating plans or the status of a project
The Elements of a Gantt Chart
Gantt charts are bar charts that depict activities in a project, their duration and their interrelationships. A project usually comprises multiple tasks. A change in one task can affect the progression of a project and it is, therefore, important to have an overview of that project.

- The individual tasks are listed in the Title column.
- The Start date determines the start position of the taskbar.
- The Finish date determines the end position of the taskbar.
- Each task is represented graphically by a taskbar.
- The % Complete indicates the progress of a task. The value is highlighted in the taskbar to give additional graphical information.
- Linked tasks are connected by connector lines. By connecting tasks, if the end date of one task changes, the connected tasks will automatically adjust to reflect the impact on the progress of the project.