A Euler diagram is a diagrammatic means of representing sets and their relationships. They are particularly useful for explaining complex hierarchies and overlapping definitions. They are similar to another set diagramming technique, Venn diagrams. Unlike Venn diagrams, which show all possible relations between different sets, the Euler diagram shows only relevant relationships.
A Euler diagram illustrating that the set of “animals with four legs” is a subset of “animals”, but the set of “minerals” is disjoint (has no members in common) with “animals”
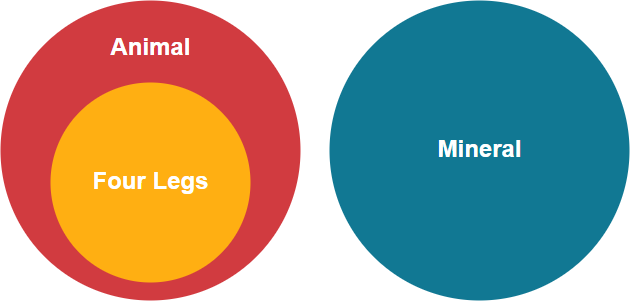
Edit this Euler diagram example
Venn Diagrams vs Euler Diagrams
Venn diagrams and Euler diagrams look very similar so it is understandable that many people find it confusing to understand the difference. Although both the diagram types rely on the set theory some subtle differences make them unique.
The key difference between these two diagrams is that a Euler diagram only shows the relationships that exist, while a Venn diagram shows all the possible relationships.
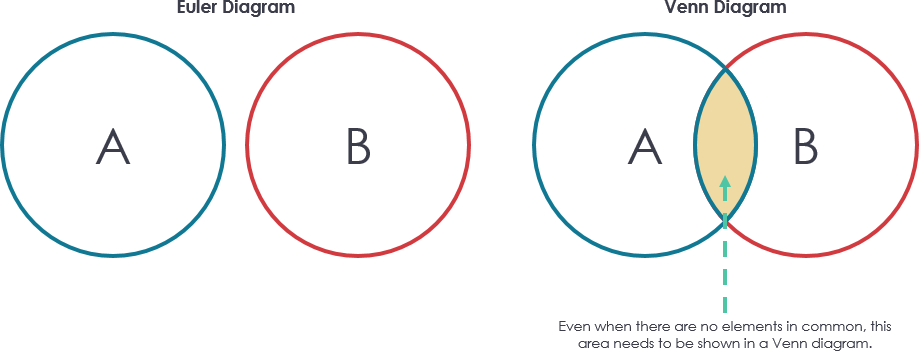
As shown above, to present a subset and a disjoint in a Venn diagram, the overlapping areas without any elements also need to be presented. In other words, in a Venn diagram, you have to depict each intersection between each set, even if the intersection is empty, while in a Euler diagram you only depict intersections that are not empty.
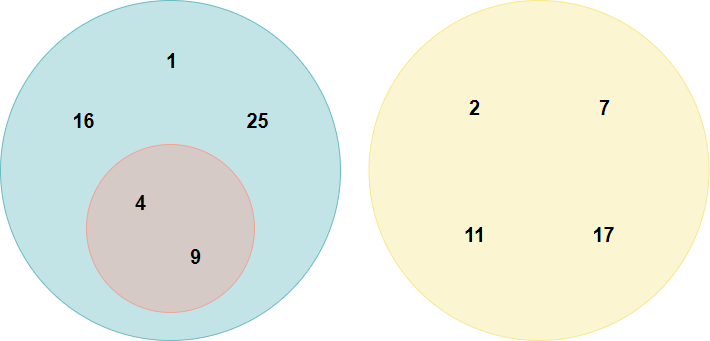
Let’s consider another example. Suppose we have three sets:
A = {1, 4, 9, 16, 25};
B = {2, 7, 11, 17};
C = {4, 9}.
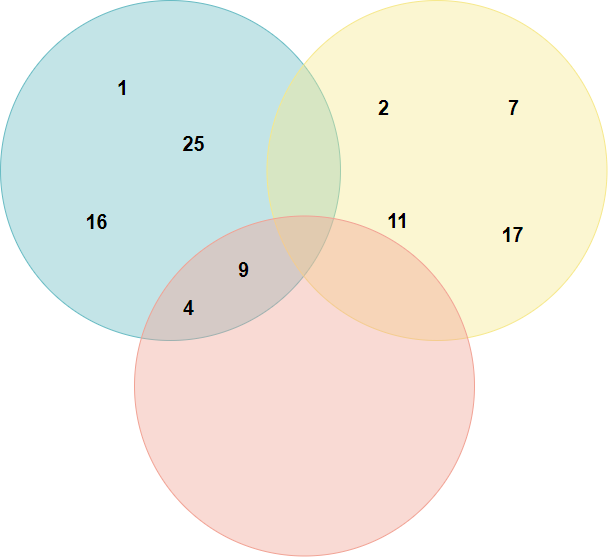
Edit this Venn diagram example