Venn diagram was named after John Venn, an English philosopher and logician, in 1880A Venn diagram is a visual tool used to compare and contrast two or more objects, events, people, or concepts. It is often used in math classes to organize differences and similarities. In mathematics, it is also called Primary Diagram, Logic Diagram or Set Diagram. This simple graphic makes it easy for anyone to understand how two things are both different and alike at the same time. Here is the use cases of Venn diagrams:
- Venn diagrams are effective in displaying the similarities or the differences between multiple data set (usually two to four).
- Venn diagrams also describe the result of unifying several data group.
- Venn Diagrams can also describe the overlapping responsibilities of two organization / team
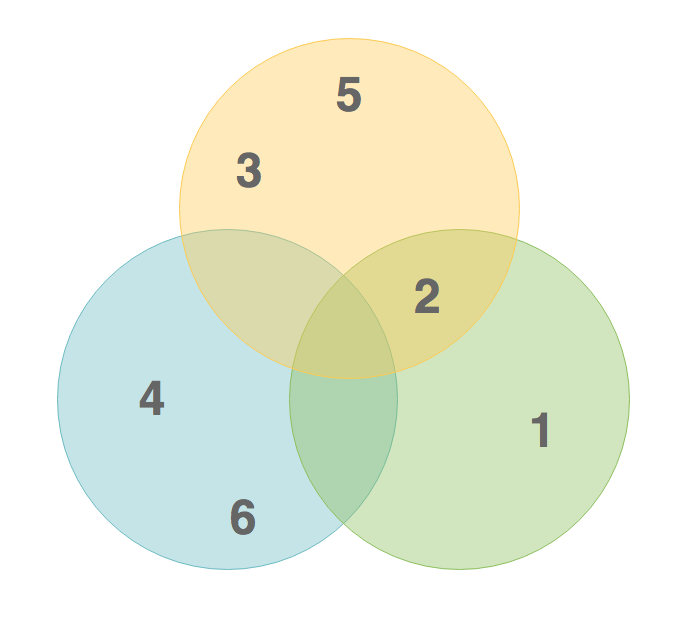
Suppose we have the three sets and the Venn diagram can be drawn as follows:
-
-
- A = {2, 3, 5}
- B = {2, 1}
- C = {4, 6}
-
Venn Diagram Examples
Listed below are some Venn diagram examples. As you can see, Venn diagram consists of overlapped oval shapes, showing content of data set as well as the data that co-exists in multiple groups.
Note that instead of ovals, Venn Diagrams can also be formed with triangles, rectangles, squares, and other shapes, although uncommon.
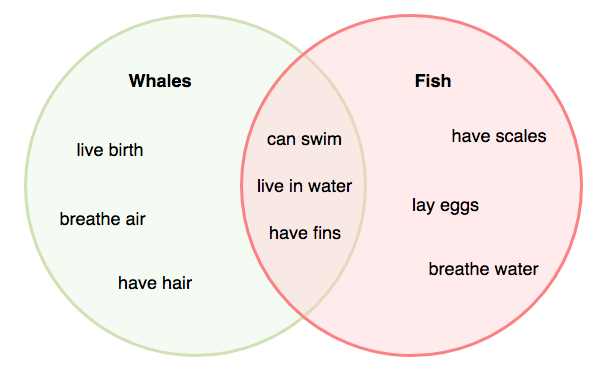
Venn Diagram Example – Share and Disparate Characteristics of 2 Things
Venn Diagrams can also be used to indicate the shared and disparate characteristics of two things. In this case, birds and bats are profiled by both their similarities and differences in a single visual.
Edit this Diagram
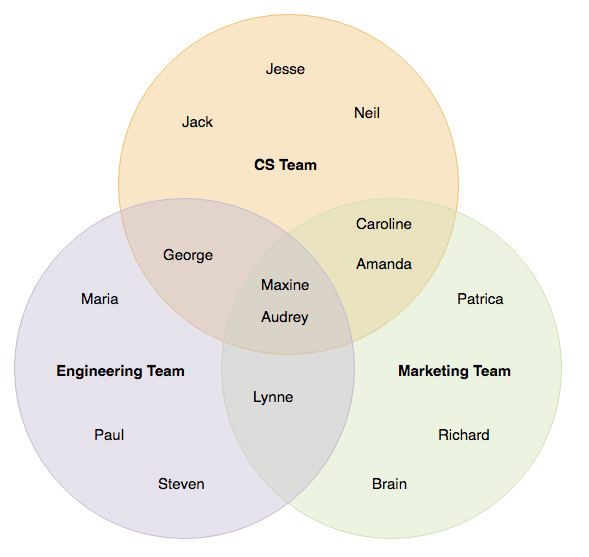
Venn Diagram Example – Team Formation
Here is a Venn diagram for team formation. This Venn diagram categorizes the team members into three sets – CS team, engineering team and marketing team. The name of members who take part in two or more teams are put under the overlapping region of the sets. With Venn diagram, you can easily recognize the relationship between sets of items, such as commonalities and differences.
Edit this Diagram
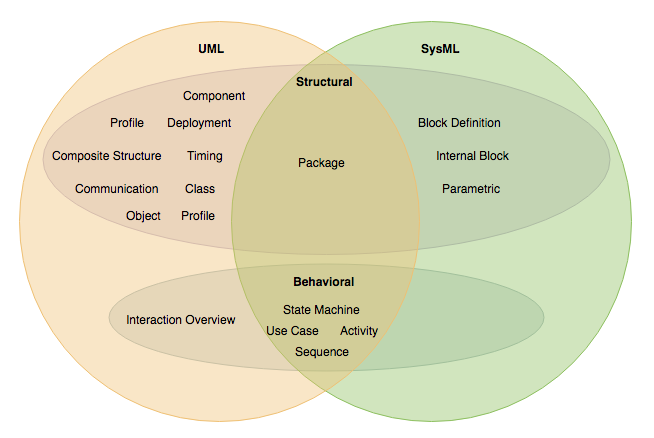
Venn Diagram Example – The Commonalities of UML and SysML Diagram Types
This is a Venn diagram example for UML and SysML. Both UML and SysML are modeling standards supported by the Object Management Group. They do share some commonalities. In this Venn diagram, you can easily see the kinds of diagrams they supported and the diagram types that are supported by them both.
Edit this Diagram