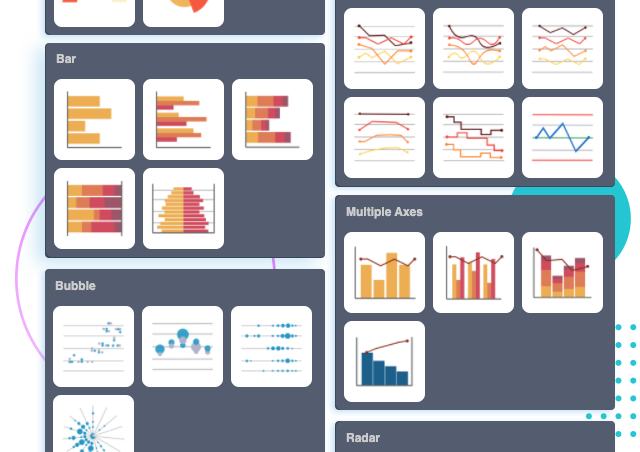
50種類以上のチャートタイプ
50種類以上のチャートタイプから最適なものをお選びいただけます。棒グラフ、折れ線グラフ、面グラフ、円グラフ、ドーナツグラフ、レーダーグラフ、バラグラフなど、一般的なチャートタイプから高度なチャートタイプまで幅広く対応しています。
Visual Paradigmのオンライン・チャート・メーカーで、データや統計を素早く簡単に視覚化できます。
50種類以上のチャートタイプから最適なものをお選びいただけます。棒グラフ、折れ線グラフ、面グラフ、円グラフ、ドーナツグラフ、レーダーグラフ、バラグラフなど、一般的なチャートタイプから高度なチャートタイプまで幅広く対応しています。
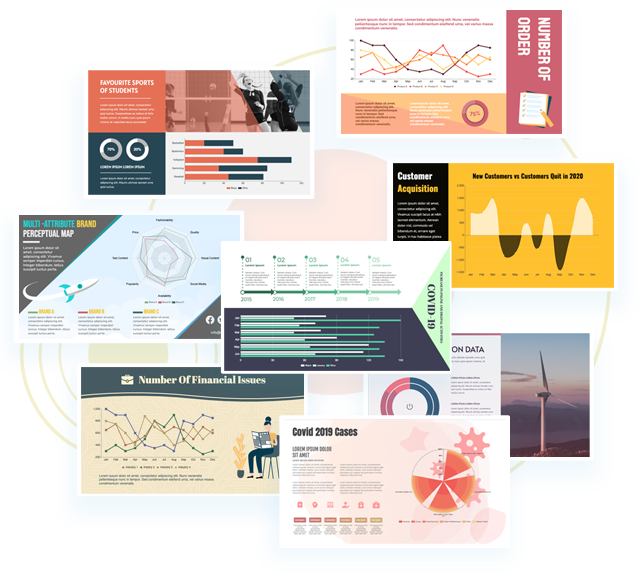
Visual Paradigm Online は、美しくプロフェッショナルなインフォグラフィックス、ポスター、プレゼンテーション、レポートなどをデザインするのに役立つ、幅広いチャートテンプレートを提供しています。テキストとチャートデータを置き換えるだけで、すぐに公開・共有できる素敵な作品ができあがります。
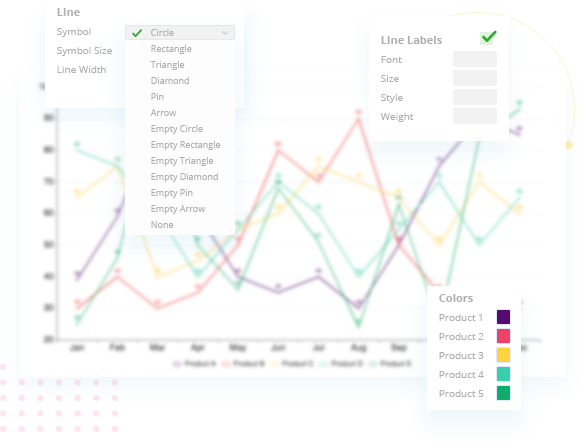
オンライン・チャート・メーカーを使えば、プロフェッショナルなチャートをオンラインで簡単に作成できます。あなたの会社のブランドカラーやフォントに合わせてチャートをカスタマイズしたり、トピックに合った色を選ぶことができます。フォントや色、タイトルや凡例の位置など、すべてを数回のクリックでカスタマイズできます。

You’ve perfected your chart—what if you could publish it as a stunning, interactive web page in just a few clicks? Now you can. We’ve integrated two powerful new features, Pipeline and Display Hall, to create a seamless workflow from creation to showcase.
Forget about downloading, exporting, and uploading files. This integrated system handles the entire journey, letting you focus on telling the story behind your data.
With Pipeline as the bridge and Display Hall as the stage, you now have an end-to-end solution to not only visualize your data but to present it with style and impact.