The interrelationship diagram (also known as network diagram or relations diagram) shows cause-and-effect relationships and helps analyze the natural links between different aspects of a complex situation that shows how different issues are related to one another. It helps to identify which issues are causing problems by identifying which issues are an outcome of other actions. It also shows the strengths of each influence. An interrelationship diagram can help us:
- Explores the cause and effect relationships among all the issues by encouraging team members to think in multiple directions rather than linearly
- It allows a team to identify the root cause(s) and subsequently design the steps necessary to respond to the complaints on the market.
- Allows key issues to emerge naturally rather than to be forced by a dominant or powerful team member
How to Create an Interrelationship Diagram?
- Agree on the issues or questions – Make sure the issue is presented as a complete sentence and is clear to all team members.
- Develop issues related to the problem – Add a symbol to the diagram for every element involved in the issue.
- Identify cause-and-effect relationships – Compare each element to all others and use an influence arrow to connect related elements.
Note That:
- The arrows should be drawn from the element that influences the one influenced.
- If two elements influence each other, the arrow should be drawn to reflect the stronger influence.
How to Interpret the Interrelationship Diagram?
- Write the counts at the bottom of each box. The ones with the most arrows are the key ideas.
- The elements with most outgoing arrows will be root causes or drivers.
- The elements with the most incoming arrows will be key outcomes or final effects that also may be critical to address.
Note That:
- Use common sense when you select the most critical issues to focus on.
- Be sure to check whether ideas with fewer arrows also are key ideas. The number of arrows is only an indicator, not an absolute rule. Draw bold lines around the key ideas.
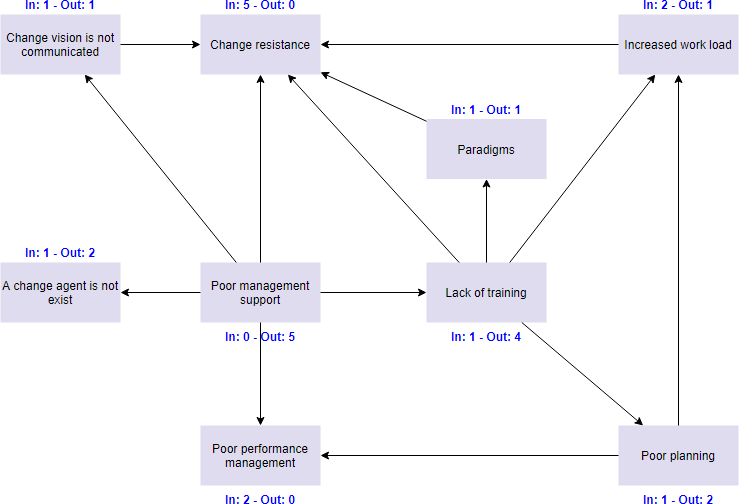
Interrelationship Diagram Example – Corporate Change Program
The following is an example of an interrelationship diagram that was created to help a team identify why a change initiative within an organization has failed to bring the anticipated benefits. Optionally, the diagram can put the totals of the incoming and outgoing arrows on the top of each item.