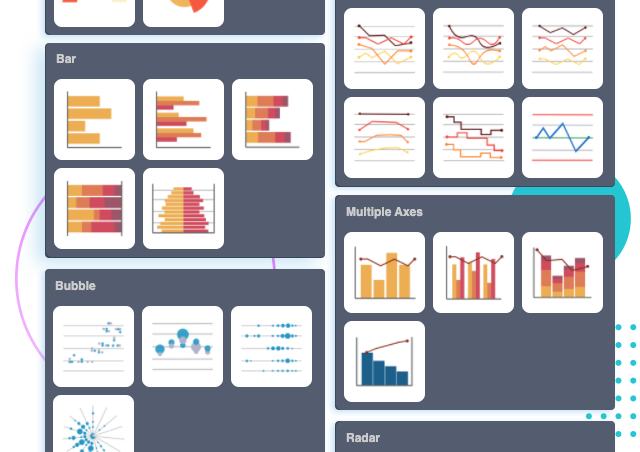
50개 이상의 차트 유형
50가지가 넘는 차트 유형 중에서 선택하여 데이터를 완벽하게 표현할 수 있습니다. 막대형, 꺾은선형, 꺾은선형, 면적형, 원형, 도넛형, 레이더형, 장미형 차트 등 일반 차트 유형과 고급 차트 유형이 모두 지원됩니다.
50가지가 넘는 차트 유형 중에서 선택하여 데이터를 완벽하게 표현할 수 있습니다. 막대형, 꺾은선형, 꺾은선형, 면적형, 원형, 도넛형, 레이더형, 장미형 차트 등 일반 차트 유형과 고급 차트 유형이 모두 지원됩니다.
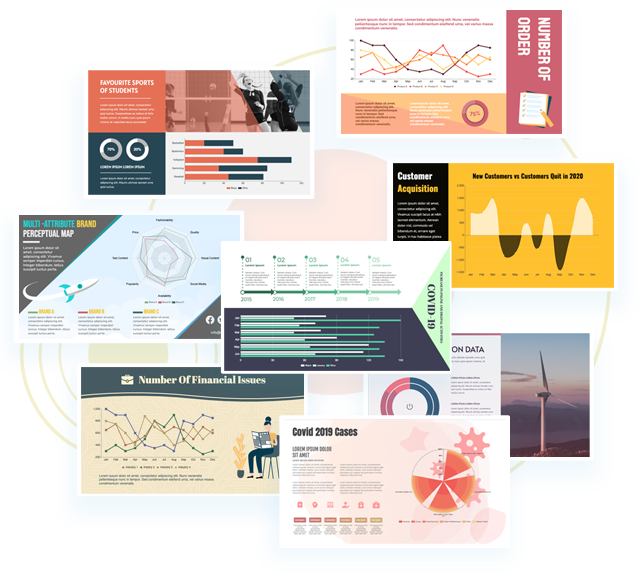
비주얼 패러다임 온라인은 아름답고 전문적인 인포그래픽, 포스터, 프레젠테이션, 보고서 등을 디자인하는 데 도움이 되는 다양한 차트 템플릿을 제공합니다. 텍스트와 차트 데이터를 교체하기만 하면 바로 게시하고 공유할 수 있는 멋진 창작물을 얻을 수 있습니다.
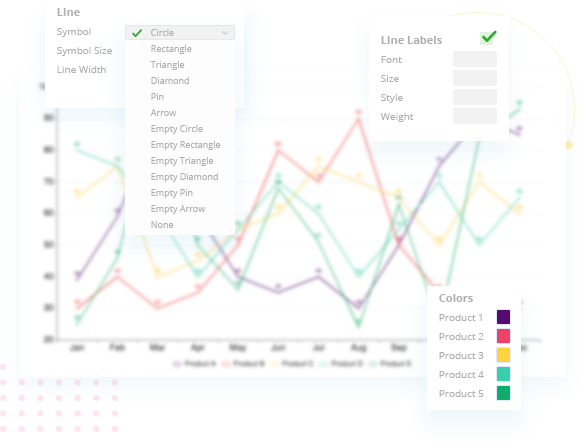
온라인 차트 메이커를 사용하면 온라인에서 전문적인 차트를 그 어느 때보다 쉽게 만들 수 있습니다. 회사의 브랜드 색상과 글꼴에 맞게 차트를 사용자 지정하거나 주제에 맞는 색상을 선택하세요. 몇 번의 클릭만으로 글꼴과 색상부터 제목과 범례의 위치까지 모든 것을 사용자 지정할 수 있습니다.

You’ve perfected your chart—what if you could publish it as a stunning, interactive web page in just a few clicks? Now you can. We’ve integrated two powerful new features, Pipeline and Display Hall, to create a seamless workflow from creation to showcase.
Forget about downloading, exporting, and uploading files. This integrated system handles the entire journey, letting you focus on telling the story behind your data.
With Pipeline as the bridge and Display Hall as the stage, you now have an end-to-end solution to not only visualize your data but to present it with style and impact.