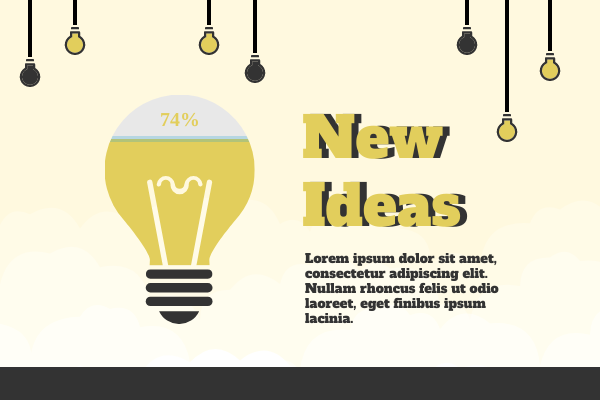
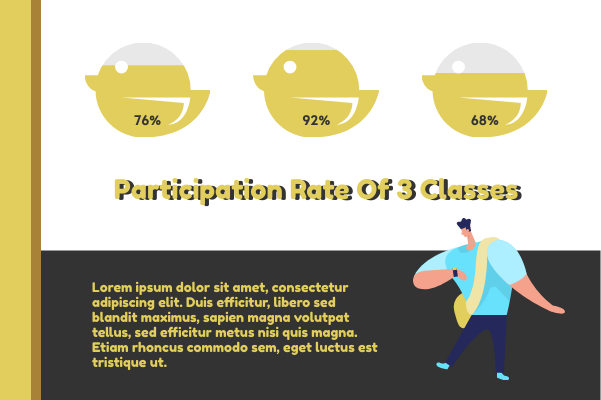
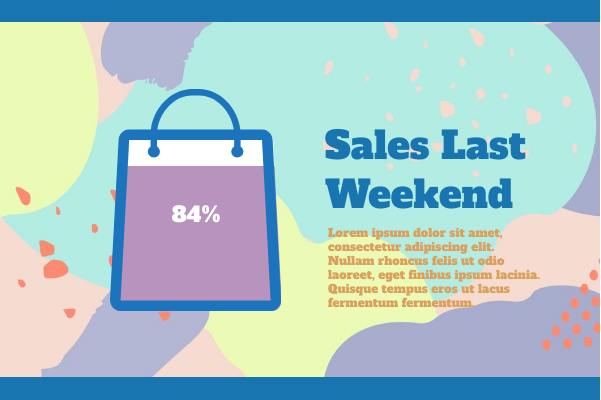
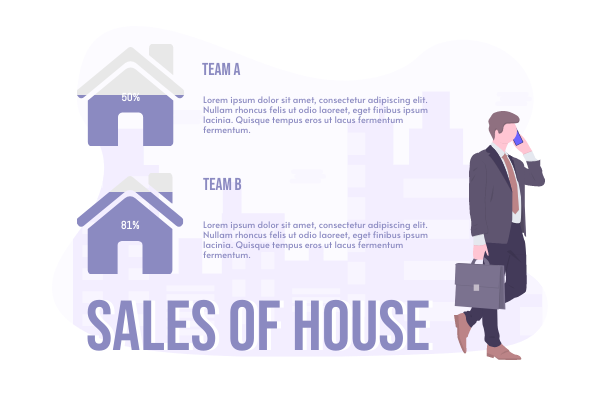
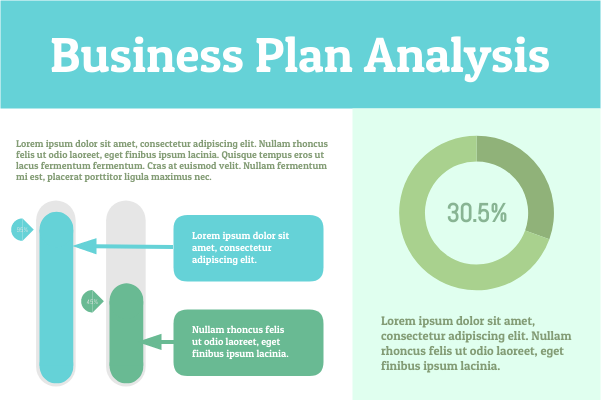
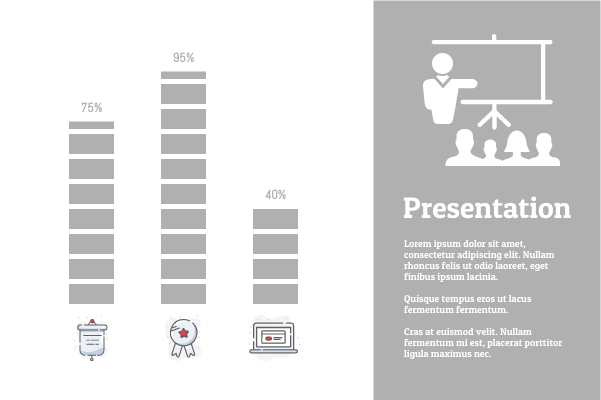
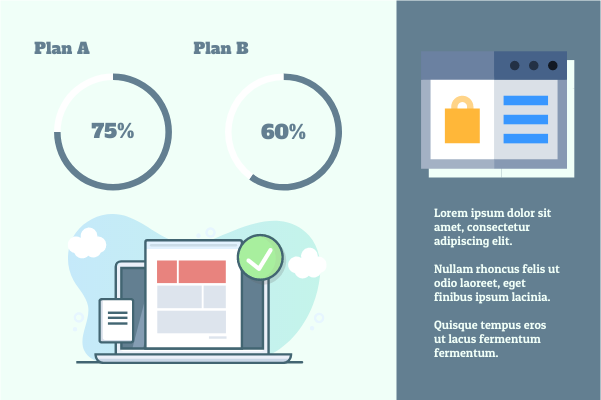
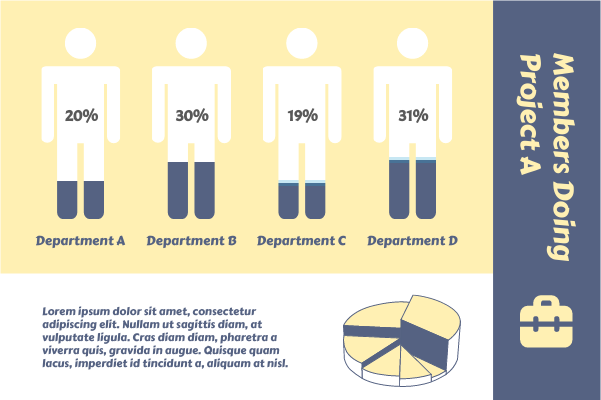
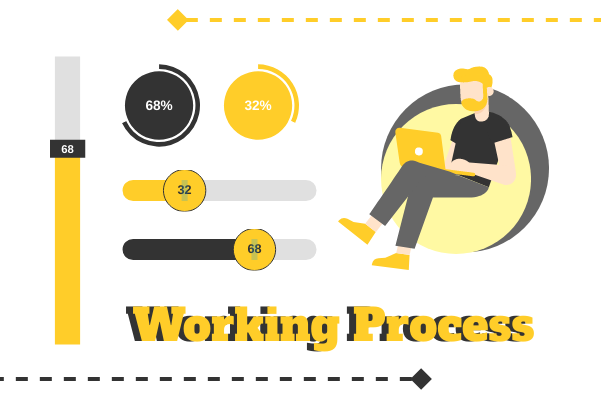
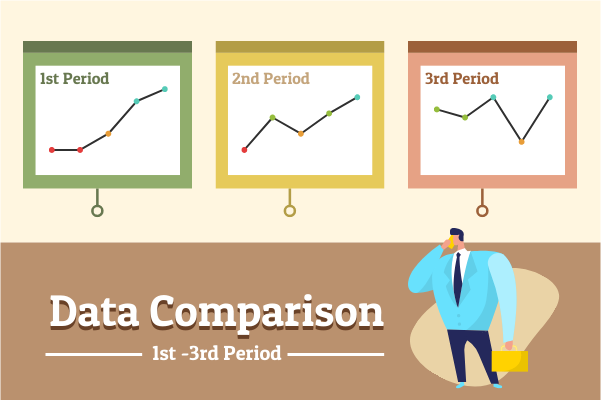
데이터 시각화는 인포그래픽과 프레젠테이션에서 중요합니다. 비주얼패러다임의 인포차트를 사용하면 통계와 수치를 멋진 데이터 위젯으로 표현할 수 있습니다. 진행률, 컨테이너, 시계 등과 같은 다양한 위젯이 지원되며 사용 사례도 다양합니다.
Design online Ebook and slideshow with Fliplify
Create 2D and 3D animations with AniFuzion.
Convert PowerPoint to online slideshow viewer
Lightweight PDF editor, tools and converters
Professional visual creations
Make flowchart, software, business diagrams
Create / edit Word, Spreadsheet & PPT
Visualize data effortlessly
Design online Ebook and slideshow with Fliplify
Create 2D and 3D animations with AniFuzion.
Convert PowerPoint to online slideshow viewer
Lightweight PDF editor, tools and converters
Make flowchart, software, business diagrams
Professional visual creations
Create / edit Word, Spreadsheet & PPT
Visualize data effortlessly
Simplify form creation
Convert files with ease
Enhance images creatively