A project roadmap is a document that outlines the processes to be followed during the implementation stage of any project.
Typically, the project team is required to incorporate project roadmap in their presentation. Here is a set of beautiful online templates to make available for servicing your needs.
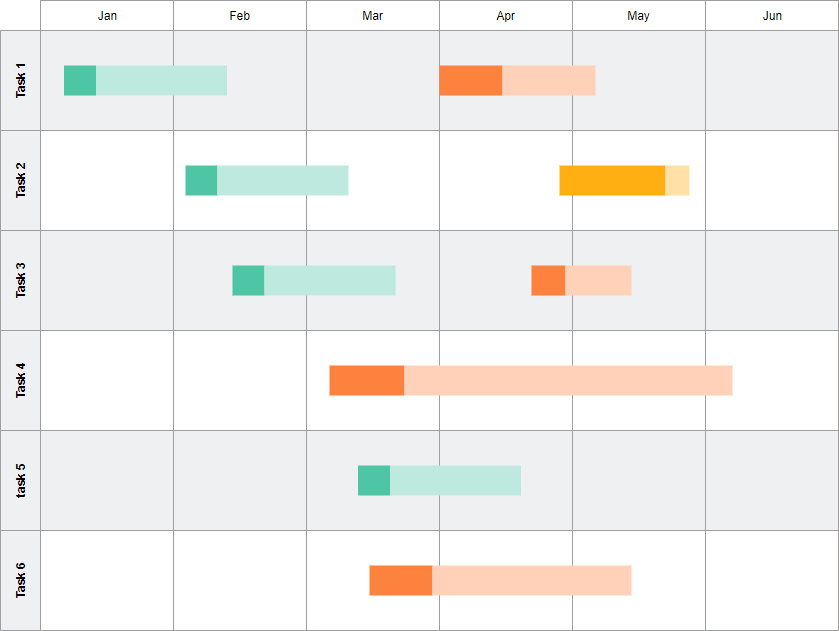
Project Scheduling: Gantt Chart and Timeline Diagram
A timeline is a chronological order of events. In most cases, it is a line with dates, events or actions. Project managers need to develop skills to build an accurate timeline. It shows what phases are already in the past, what is in the progress now and what is supposed to be finished in the future. It means it helps to be on projects’ tracks.
Edit this Roadmap diagram example
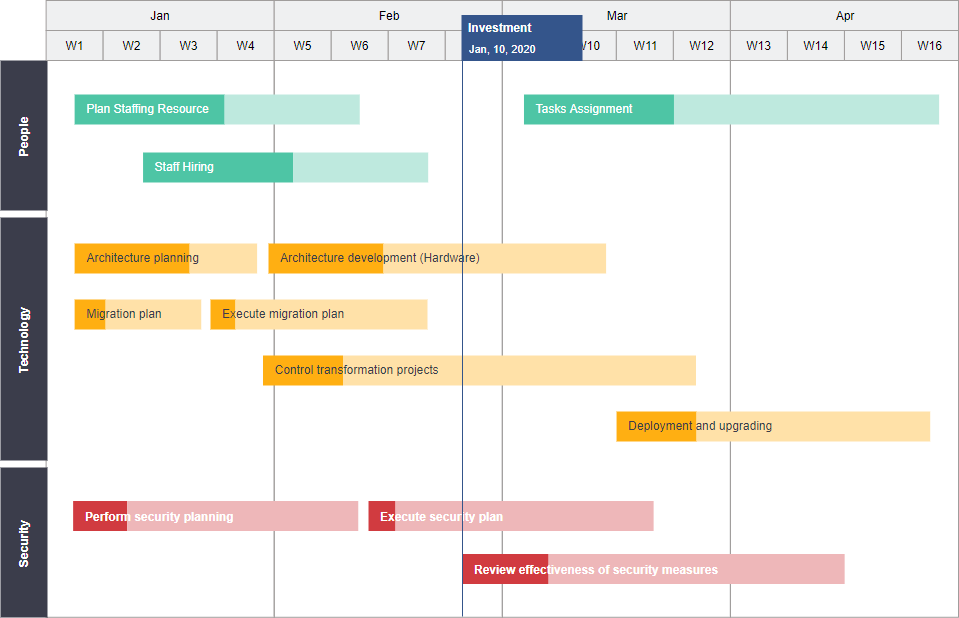
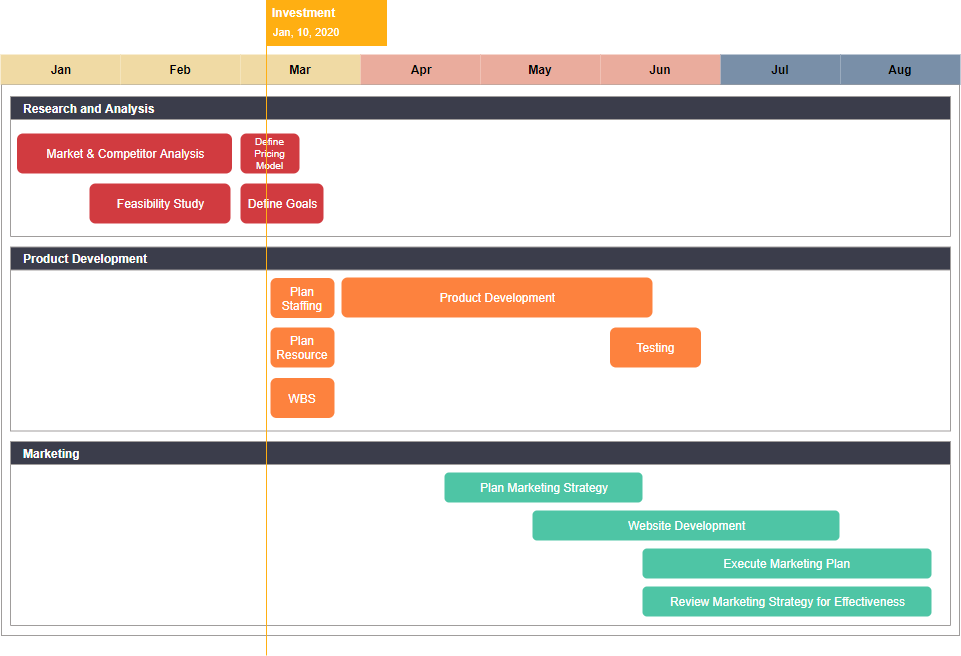
Gantt Chart Infographic for Presentation Purpose
A Gantt chart timeline is the most popular and widespread type of timelines that are used for many years. That is why many project management tools have a Gantt chart view where it is so easy to get a clear project picture. There is a horizontal line that shows periods. All events, actions, and tasks are labeled along this line. Thus, it is very easy to understand past, current and future assignments and actions.
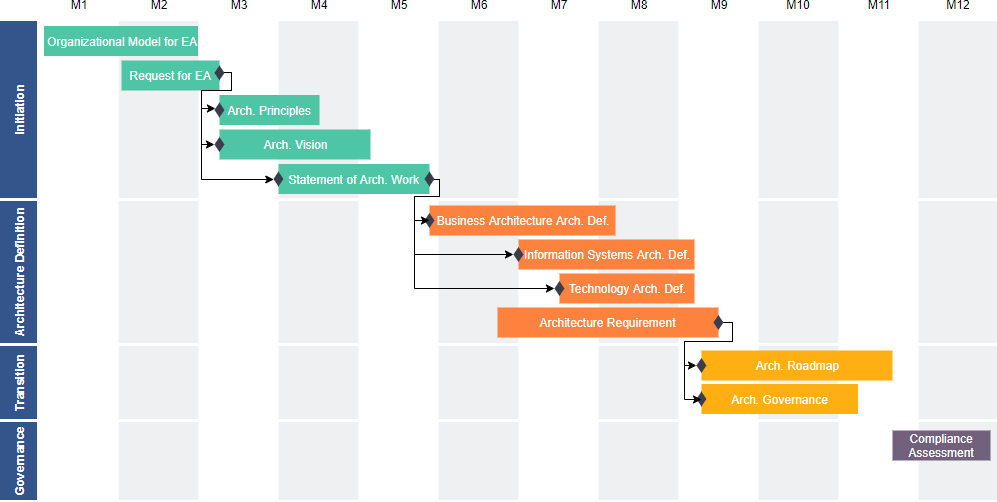
Edit this Transition Plan (roadmap) template
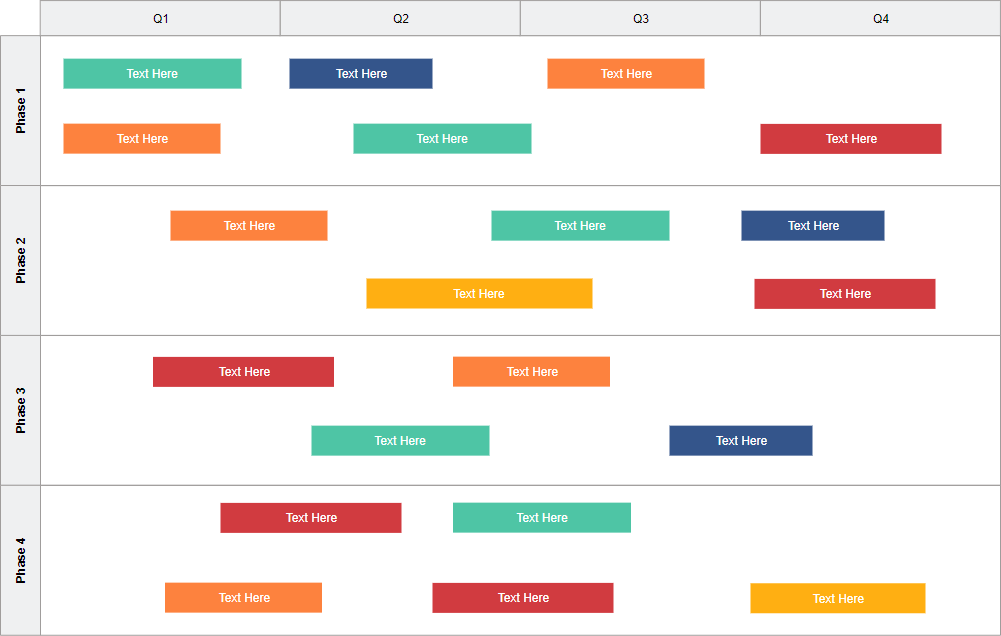
Edit this simple roadmap template
Edit this product launch roadmap template
Edit this Enterprise IT roadmap template
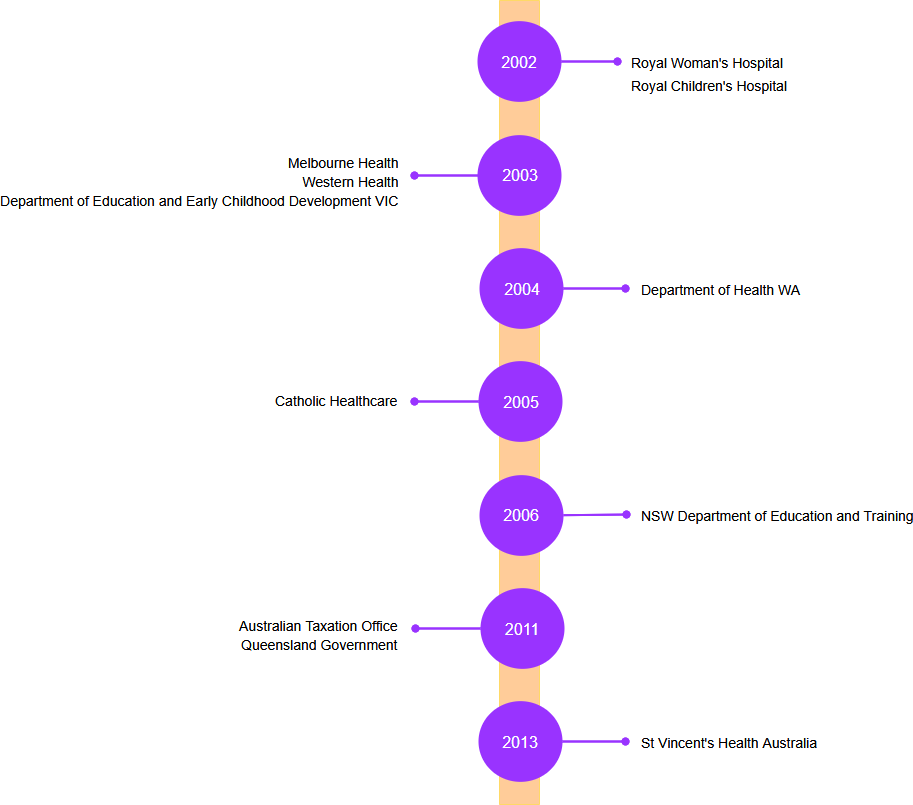
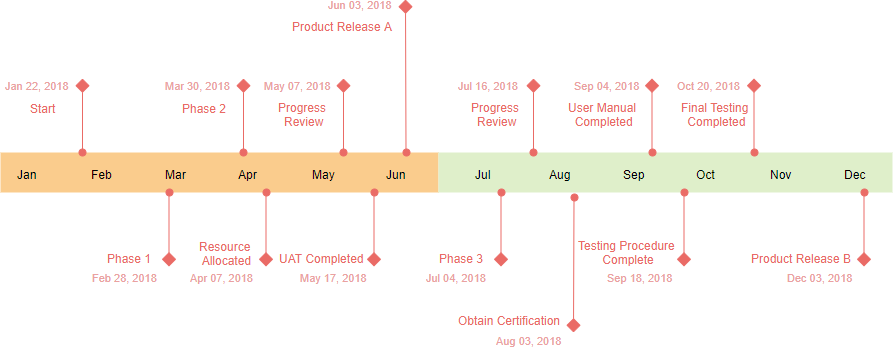
Chronological Timeline for Presentation
A chronological timeline is a display of a list of events in chronological order which is typically a long bar labeled with dates paralleling it. A timeline diagram is typically used for representing chronology which can cover a short period or hundreds of years. It provides a visual representation of events that helps you better understand history, a story, a process or any other form of an event sequence arranged in chronological order and displayed along a line (usually drawn left to right or top to bottom). It explains what happened during a certain period or to a particular person, starting with the earliest event and moving forward through time. Increasingly, timelines are illustrated in infographics combining text and graphic images for a better presentation.
Other Horizontal Timeline Diagram Templates
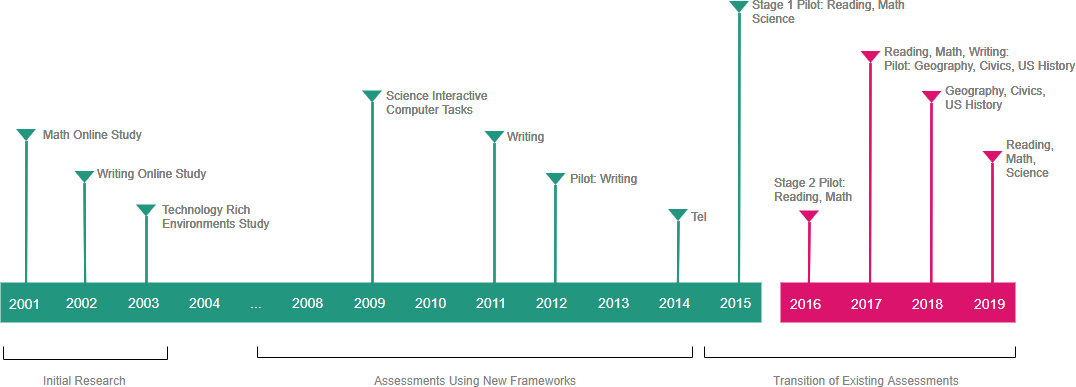
Edit this Book Study timeline example
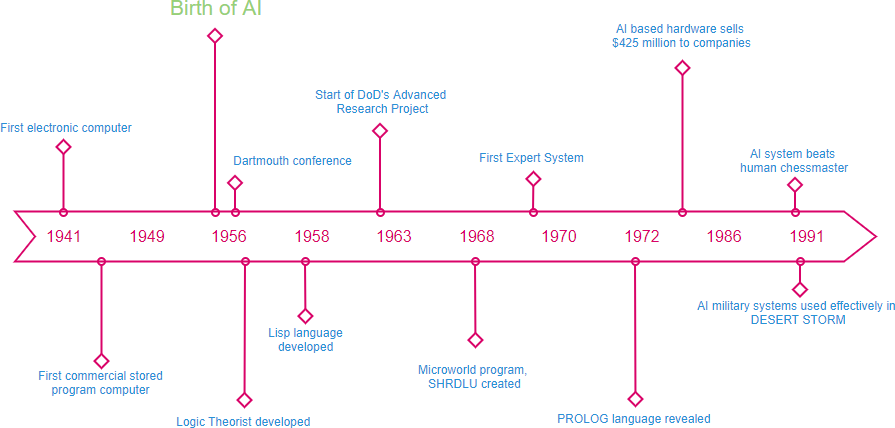
Edit this A.I. timeline example
Vertical Timeline Examples