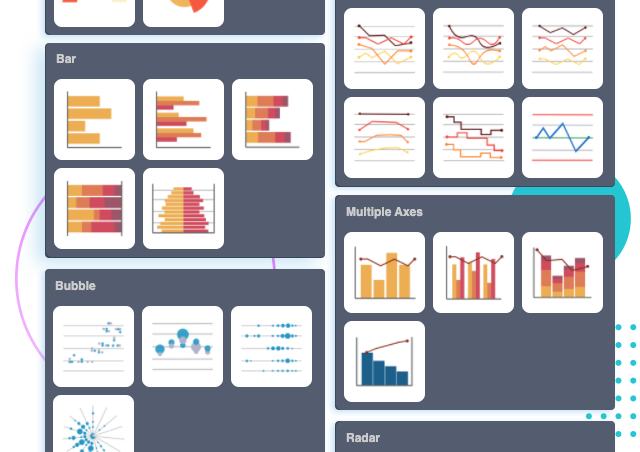
50 多種圖表類型
從50多種圖表類型中進行選擇,以找到數據的完美表示。支持普通圖和高級圖表類型,包括條,線,區域,餅圖,圓環圖,雷達和玫瑰圖。
從50多種圖表類型中進行選擇,以找到數據的完美表示。支持普通圖和高級圖表類型,包括條,線,區域,餅圖,圓環圖,雷達和玫瑰圖。

Visual Paradigm Online提供了廣泛的圖表模板,可幫助您設計精美和專業的信息圖表,海報,演示文稿,報告等。只需替換文本和圖表數據,然後您就可以獲創作,準備出版和共享。
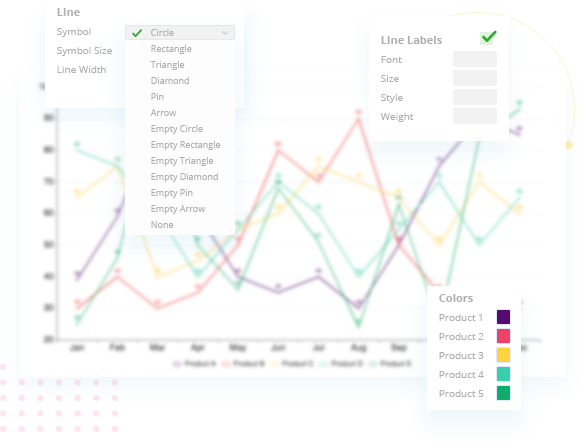
使用我們的在線圖表製造商,在線創建專業圖表比以往任何時候都容易。自定義圖表以匹配公司的品牌顏色和字體,或選擇與您的主題相匹配的顏色。只需單擊幾下即可自定義所有內容,從字體和顏色到標題和圖例的位置。

You’ve perfected your chart—what if you could publish it as a stunning, interactive web page in just a few clicks? Now you can. We’ve integrated two powerful new features, Pipeline and Display Hall, to create a seamless workflow from creation to showcase.
Forget about downloading, exporting, and uploading files. This integrated system handles the entire journey, letting you focus on telling the story behind your data.
With Pipeline as the bridge and Display Hall as the stage, you now have an end-to-end solution to not only visualize your data but to present it with style and impact.