Activity Diagram Tutorial
Activity Diagram is similar to a business work flow diagram or simply a flowchart with much richer semantics. It describes the system activities, or the person who does the activity, and the sequential flow of these activities. The activity diagram is one of the UML diagrams associated with object oriented approach, through it can be used in any other software development paradigm
What is a Activity Diagram in UML?
Activity Diagrams can be used to describe how activities are coordinated to provide a service at different levels of abstraction. The great strength of activity diagrams lies in the fact that they support and encourage parallel behavior. This makes them a great tool for workflow modeling and, in principle, for multithreaded programming. Activity diagrams can also define a link to an object by labeling an activity with an object name or by using swimlanes, which enable an activity diagram to be structured based on responsibilities.
Try it!
Finding an online Activity Diagram tool? Just click the Draw button below to create your Activity Diagram online. Visual Paradigm Online is free* and intuitive. You can also go through this Activity Diagram tutorial to learn about Activity Diagram before you get started.
Draw NowActivity Diagram at a Glance
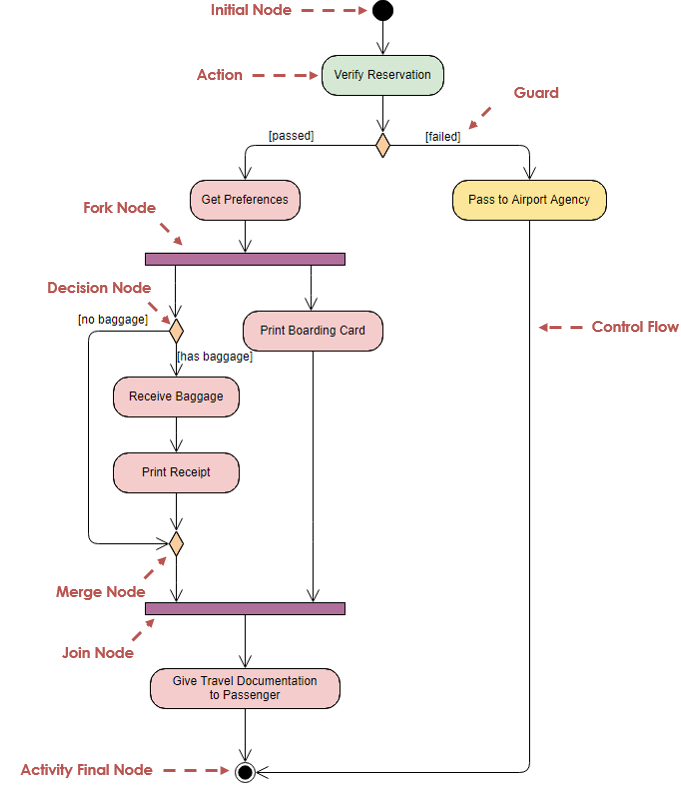
Before we go into the details of individual notation in activity diagram, let us have a quick look at a very general activity diagram. Here is the example activity diagram for elaborating the business use case - Check-In in Airport:
Activity Diagram Notations
Initial, Final and Flow Final Node
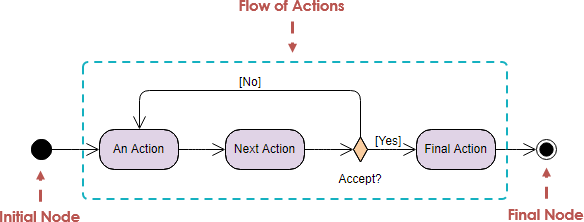
Initial Node (Start State)
- The starting state before an activity takes place is depicted using the initial state.
- A process can have only one initial state unless we are depicting nested activities. We use a black filled circle to depict the initial state of a system.
- The Initial State from the UML Activity Diagram marks the entry point and the initial Activity State.
Final Node (End State)
In the UML, a final action state is shown using a circle surrounding a small solid filled circle (a bull's eye). An activity diagram may have only one initial action state, but may have any number of final action states.
Flow Final Node
UML 2.0 has an additional control node type called Flow Final that is used as an alternative to the Activity Final node to terminate a flow. It is needed because in UML 2.0, when control reaches any instance of Activity Final node, the entire activity (including all flows) is terminated. The Flow Final simply terminates the flow to which it is attached.
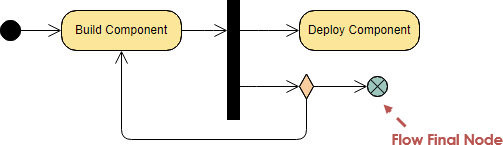
Note: This was not an issue in UML 1.5 because of the run-to-completion semantics, but with the unrestricted parallelism of UML 2.0, you might not want all flows stopped and all tokens destroyed.
Action and Activity State
An activity, also known as an activity state, on a UML Activity diagram typically represents the invocation of an operation, a step in a business process, or an entire business process.
Action is a named element which represents a single atomic step within activity i.e. that is not further decomposed within the activity.
Flow Transition
Given a collection of action states, how are those action states related to one another? Flow transitions address this issue, a flow transition shows how action states are ordered or sequenced. There are various types of flow transitions, including control-flow and object-flow transitions.
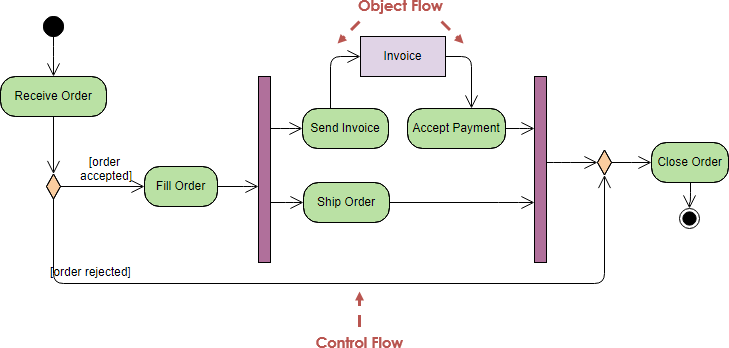
Control Flow
Action flows or Control flows are also referred to as paths and edges. They are used to show the transition from one activity state to another. An activity state can have multiple incoming and outgoing action flows. We use a line with an arrow head to depict a Control Flow. If there is a constraint to be adhered to while making the transition it is mentioned on the arrow.
In the UML, a control-flow transition is shown as a solid line from a source action state to a target action state.
Object Flow
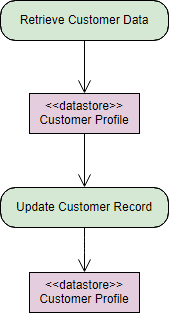
In the UML, an object-flow transition is shown as a dashed arrow between an action state and an object. An action state that uses an object as input is shown with the object-flow transition arrow pointing from the object to the action state. An action state that updates or produces an object as output is shown with the object-flow transition arrow pointing from the action state to the object.
- An object produced or used by actions. This allows us to model object flows.
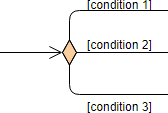
Decision Nodes and Branching
When we need to make a decision before deciding the flow of control, we use the decision node, such as one incoming transition, and multiple outgoing parallel transitions and/or object flows.
Decision Node
- A decision node accepts tokens on an incoming edge and presents them to multiple outgoing edges.
- Which of the edges is actually traversed depends on the evaluation of the guards on the outgoing edges.
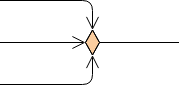
Merge Node
- A merge node is a control node that brings together multiple alternate flows.
- It is not used to synchronize concurrent flows but to accept one among several alternate flows.
- A merge node has multiple incoming edges and a single outgoing edge.
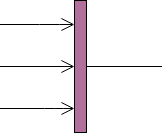
Fork Node
- A fork node is a control node that splits a flow into multiple concurrent flows.
- A fork node has one incoming edge and multiple outgoing edges.
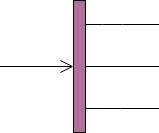
Join Node
- A join node is a control node that synchronizes multiple flows.
- A join node has multiple incoming edges and one outgoing edge.
Guard
A guard is a condition that must be true in order to traverse a transition.
Object Node
UML 2.0 activity modeling also supports object nodes. An object node is an activity node that indicates that an instance of a particular classifier, possibly in a particular state, might be available at a particular point in the activity (for example, as output from, or input to an action). Object nodes act as containers to and from which objects of a particular type (and possibly in a particular state) might flow.

Data Store
A datastore is a stereotype for an object which stores objects persistently.
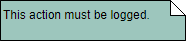
Note
- A note (comment) gives the ability to attach various remarks to elements.
- A comment carries no semantic force, but may contain information that is useful to a modeler.
Swimlane
A swimlane activity diagram groups the activities into swimlanes columns that contain all of the activities which fit into the category represented by that swimlane. Swimlanes can represent many categories of information such as actors which perform the activities (i.e., role or department), the stage of the process in which the activity takes place, or whatever else the creator of the document feels should be emphasized and communicated by the swimlane diagram. The term swimlane was adopted due to the visual similarity between the horizontal rows of the diagram to that of the swimlanes found within a swiming pool.
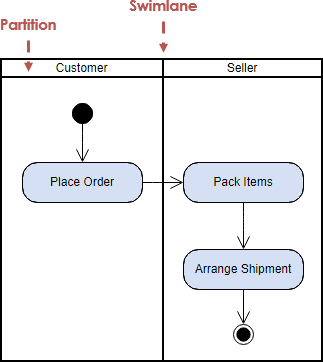
In the UML, a swimlane is shown as a visual region separated from neighboring swimlanes by vertical solid lines on both sides and labeled at the top with the element responsible for action states within the swimlane.
Time Event & Event Signal
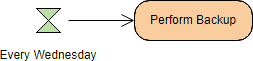
Time event flows when the time expression is true, while event signal flows when a event occurs. An hourglass symbol can be used to represent the acceptance of a time event.
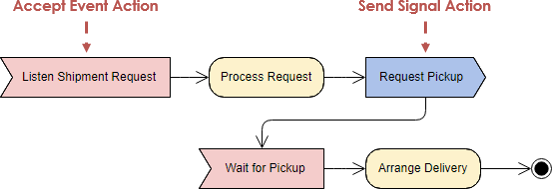
Accept Event Action is an important element for business processes in activity diagrams. Accepting action waits for an event to occur. After the event is accepted, the flow that comes from this action is executed.
Send Signal Action is a signal being sent to an accepting activity which can react accordingly.
When to draw Activity Diagram?
An activity diagram is used to model the workflow depicting conditions, constraints, sequential and concurrent activities. On the other hand, the purpose of a use case is to just depict the functionality i.e. what the system does and not how it is done. So in simple terms, an activity diagram shows 'How' while a Use case shows 'What' for a particular system, thus, activity diagrams are often in pairs with use cases.
In terms of UML, we can use activity diagram for the following purposes, for example:
- Model complex activities and business workflows in a high level activity diagram
- Identify candidate use cases and pre- and post-conditions for use cases through the examination of business workflows
- How the events within a single use case relate to one another, and in particular, where activities may overlap and require coordination among use cases
- How a collection of use cases coordinate to create a workflow for an organization
- Model workflows between/within use cases
Note: An activity diagram can be used to illustrate a business process (high level implementation) to a stand alone algorithm (ground level implementation).
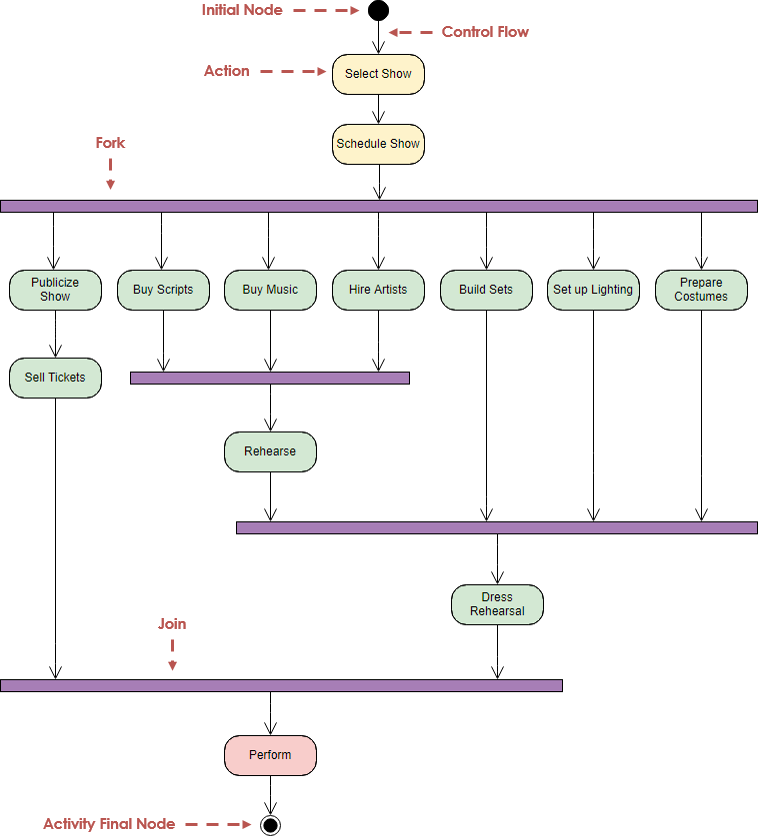
Activity Diagram Examples
This example shows an activity diagram for the theatre office. This diagram shows the activities involved in planning a show.
- Arrows show sequential dependencies—for example, shows must be picked before they are scheduled.
- Heavy bars show forks or joins of control. For example, after the show is scheduled, the theatre can begin to publicize it, buy scripts, hire artists, build sets, design lighting, and make costumes, all concurrently. Before rehearsal can begin, however, the scripts must be ordered and the artist must be hired.
An activity diagram is helpful in understanding the high-level execution behavior of a system, without getting involved in the internal details of message passing required by a collaboration diagram.
Shipping Process
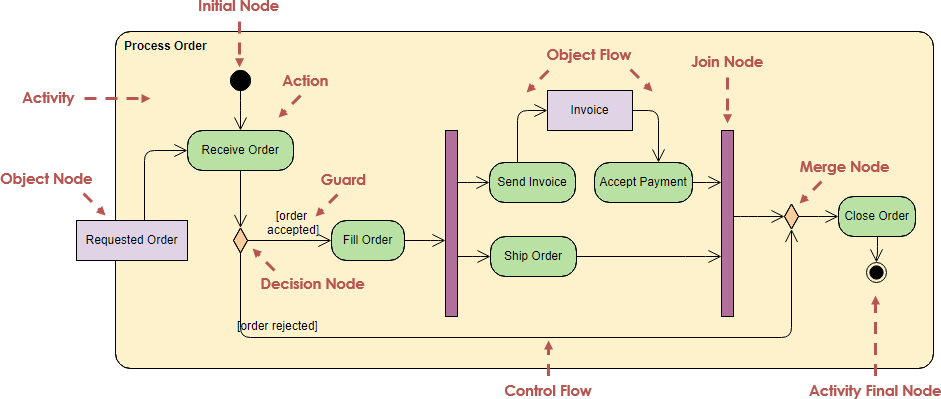
The following example describes a business flow activity of order processing. In the Figure below, the requested order is input parameter of the activity. After order is accepted and all required information is filled in, payment is accepted and order is shipped.
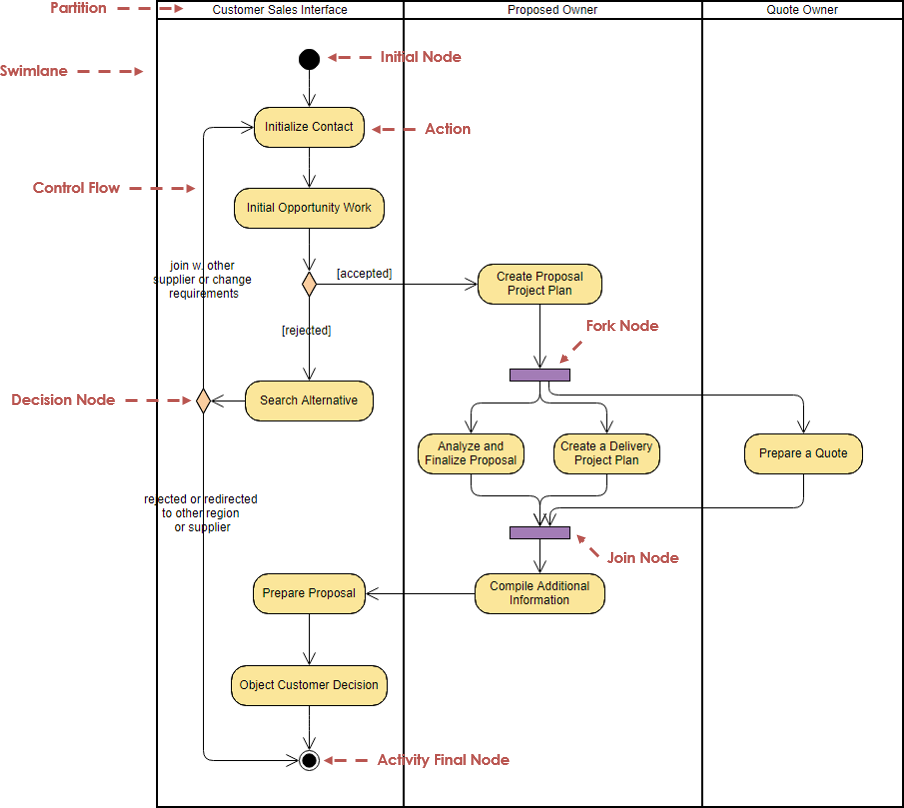
Example – Activity Diagram – Business Proposal Process
Activity diagrams can also be used to described the roles and areas of responsibilities in the business – in other words who is responsible for doing what in the business. Roles and areas of responsibilities are documented as columns (UML swimlanes) in the activity diagram. Swimlanes show which business workers participate in the realization of the workflow
This activity diagram documenting how the business performs a Proposal process, with three areas of responsibilities (Customer Sales Interface, Proposal Owner, and Quote Owner)
More Class Diagram examples:
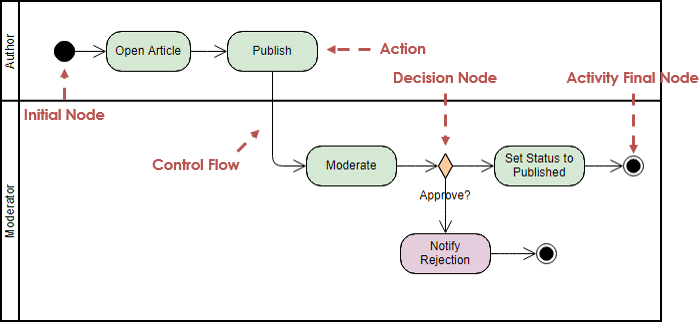
Example 1: Article Submission Process
Example 2: Multidimensional Swimlanes
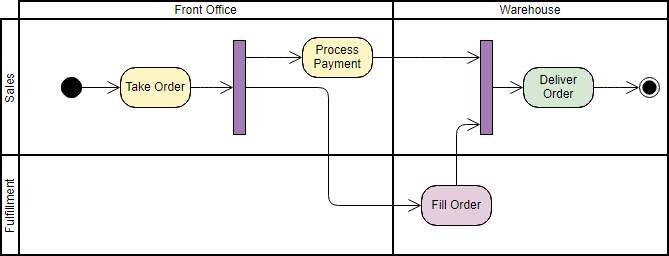
UML 2.0 extends this partitioning capability to multiple dimensions for activity diagrams and provides additional notation, so that individual actions can be labeled with the name of the partition to which they belong.
The diagram below shows an example of multidimensional swimlanes as they would appear according to UML 2.0, where actions are grouped according to location and responsibility.
Want to draw a Activity Diagram?
You've learned what a Activity Diagram is and how to draw a Activity Diagram step-by-step. It's time to get your hands dirty by drawing a Activity Diagram of your own. Draw UML diagrams free* with Visual Paradigm Online. It's easy-to-use, intuitive.
Draw Now* The Free edition supports free usage of Visual Paradigm Online for non-commercial use only.