A Gantt chart is a bar chart that shows the tasks of a project published by Henry Gantt in around 1910-1915. Modern Gantt charts also show the dependency relationships between activities and current schedule status. This visual representation is often in the form of a software tool, although the idea of a paper-based Gantt chart is also not unfamiliar to many project managers.
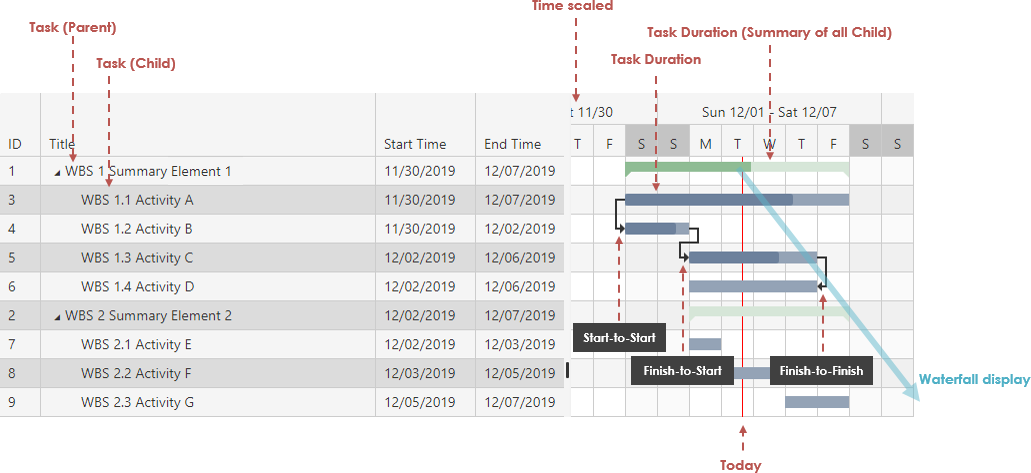
This chart lists the tasks to be performed on the vertical axis, and time intervals on the horizontal axis. The width of the horizontal bars in the graph shows the duration of each activity. Gantt charts illustrate the start and finish dates of the terminal elements and summary elements of a project. Terminal elements and summary elements constitute the work breakdown structure of the project. Modern Gantt charts also show the dependency (i.e., precedence network) relationships between activities.
When to Use Gantt Charts?
If you have a project that only involves a few specific tasks then you probably don’t need to go to the trouble of creating a Gantt chart. These tasks can likely be kept track of in a list, or a table without needing a graphical representation of the work that needs to be done. On the other hand, a large project with many tasks and deliverables will be hard to visualize if you include every single task.
Larger projects like this should have tasks grouped into smaller mini-projects or milestones if you want to display the schedule graphically using a Gantt chart. Most of our work can be broken down into projects, or deliverables over time. You can also use Gantt charts to keep track of multiple projects (known as Program Management).

Gantt charts are often used by project managers and are especially useful for quickly analyzing project plans to ensure that all tasks can be completed in time. But, it’s not just project managers that can benefit from organizing schedules. It is also a great tool to use for reporting to other stakeholders or executives on a regular basis.
Gantt charts are considered program management and project planning tool and they typically serve the following purposes:
- Scheduling and monitoring tasks within a project
- Communicating plans or the status of a project
- The steps of the project or process, their sequence, and their duration are known
- You don’t need to show which tasks depend on the completion of previous tasks
How to Create a Gantt Chart?
A Gantt chart is a type of bar chart for project management that helps project managers to fine-tune the project timeline as general task planning for any size of projects. For those who want to create a Gantt chart to help with time management, organization or in-depth analysis of a project, here are some of the most common steps involved in that process.
- The basic procedure starts with identifying tasks to include in your Gantt chart. Determine the:
- Tasks needed to complete the project.
- Key milestones in the project by brainstorming a list, or by drawing a flowchart, storyboard, or arrow diagram for the project.
- Time required for each task.
- Sequence of events. Which tasks must be finished before the next task can begin, and which can happen simultaneously? Which tasks must be completed before each milestone?
- Draw a horizontal time axis along the top or bottom of a page. On the axis, mark an appropriate scale for the length of the tasks (days or weeks).
- Down the left side of the page, write each task and milestone of the project in order. For events that happen at a point in time (such as a presentation),
- Draw a diamond under the time the event must happen. For activities that occur over a period of time (such as developing a plan or holding a series of interviews),
- Draw a bar that spans the appropriate times on the timeline. Align the left end of the bar with the time the activity begins, and align the right end with the time the activity concludes.
- Draw just the outlines of the bars and diamonds; don’t fill them in.
- Check that every task of the project is on the chart.
Using Visual Paradigm Online Gantt Chart