Program Evaluation Review Technique (PERT charts for short). A PERT chart is a project management tool that provides a graphical representation of a project’s timeline for breaking down the individual tasks of a project for analysis. The technique was initially developed by the Navy in the 1950s for the Polaris submarine project. Today, PERT charts are used by teams across industries looking to plan and execute their projects more effectively.
Why and When to use PERT for Project Planning?
Complex projects require a series of activities, some of which must be performed sequentially and others that can be performed in parallel with other activities. This collection of series and parallel tasks can be modeled as a network to illustrate how those tasks and milestones are prioritized—i.e., their precedence.
A PERT chart is usually created after most of a project’s tasks have been identified. PERT analysis is best performed near the end of project planning because you need to have at least a basic idea of which tasks are critical and which are less so. Project managers can use PERT charts to:
- It facilitates identification of the critical path and makes this visible
- It provides visualize project activities and their dependencies offering possible improvement opportunities and optimization of the project plan
- It helps to identify the early start, the last start and slack for each activity
- It allows project managers to do ‘what if’ analysis of project activities.
How to Identify Tasks and Activities for Projects?
Managing large-scale, complicated projects effectively is a difficult problem. The first step in planning and scheduling a project is to develop the work breakdown structure (WBS) for identifying activities that must be performed and their beginning and ending events. We also need to identify time, cost, resource requirements, predecessors, and people responsible for each activity and thus a schedule for the project than can be developed.
A Work Breakdown Structure (WBS) is a decomposition of all the work necessary to complete a project which is arranged in a hierarchy and constructed to allow for clear and logical groupings, either by activities or deliverables. A Work Breakdown Structure is a critical tool for organizing work, building realistic schedules and cost estimates, and controlling, which is a grouping of project work elements to organize and subdivide the total work scope of a project.
Work Breakdown Structure Diagram
The Work Breakdown Structure (WBS) is developed to establish a common understanding of project scope. It is a hierarchical description of the work that must be done to complete the deliverables of a project. Each descending level in the WBS represents an increasingly detailed description of the project deliverables.
The first two levels of the WBS (the root node and Level 2) define a set of planned outcomes that collectively and exclusively represent 100% of the project scope. At each subsequent level, the children of a parent node collectively and exclusively represent 100% of the scope of their parent node. Here is a Work Breakdown Structure example:
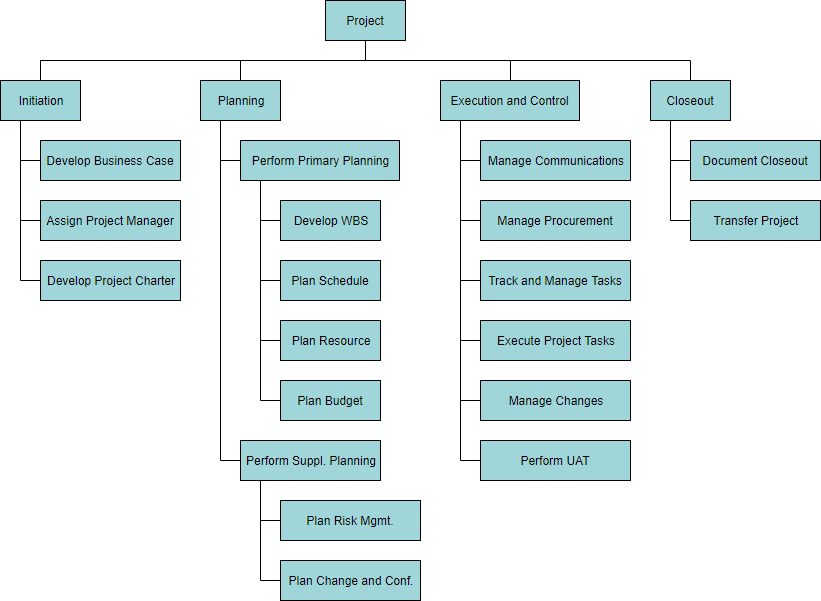
Edit this Work Breakdown Structure
How to Create a PERT Chart?
PERT planning involves the following steps that are described below.
- Identify the specific activities and milestones – The activities are the tasks required to complete a project (i.e. use WBS as described above). The milestones are the events marking the beginning and the end of one or more activities. It is helpful to list the tasks in a table that in later steps can be expanded to include information on sequence and duration.
- Determine the proper sequence of the activities – This step may be combined with the activity identification step since the activity sequence is evident for some tasks. Other tasks may require more analysis to determine the exact order in which they must be performed.
- Construct a PERT diagram – Using the activity sequence information, a network diagram can be drawn showing the sequence of the serial and parallel activities. Each activity represents a node in the network, and the arrows represent the relationship between activities. Software packages simplify this step by automatically converting tabular activity information into a network diagram.
- Estimate the time required for each activity – Weeks are a commonly used unit of time for activity completion, but any consistent unit of time can be used. A distinguishing feature of PERT is its ability to deal with uncertainty in activity completion time. For each activity, the model usually includes three-time estimates mentioned above.
- Update the PERT chart as the project progresses – Make adjustments in the PERT chart as the project progresses. As the project unfolds, the estimated times can be replaced with actual times. In cases where there are delays, additional resources may be needed to stay on schedule and the PERT chart may be modified to reflect the new situation.
PERT Chart Examples
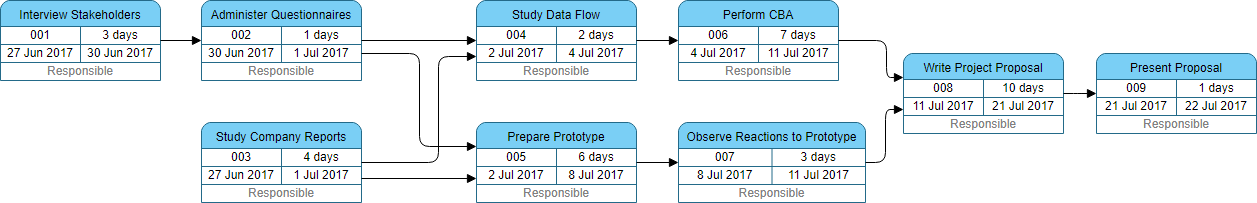
Project Preparation Example – The following PERT Chart shows:
Suppose a systems analyst is trying to set up a realistic schedule for the data gathering and proposal phases of the systems analysis and design life cycle. The systems analyst looks over the situation and lists activities that need to be accomplished along the way, and formed a PERT Chart as follows:
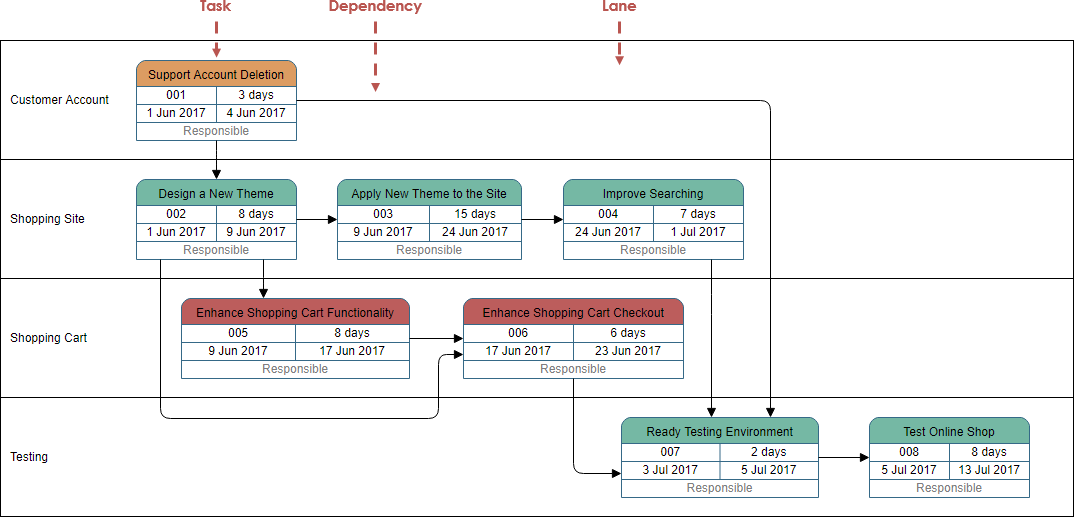
Software Development Template – The PERT Chart example below shows:
A lane allows you to arrange your Pert Chart into horizontal zones separated by lines. Each zone represents the responsibilities of the particular class, worker or any concepts which the group of tasks it is responsible for. In this example, a generic template for software project management from analysis, design, build and test with phase in the lane.
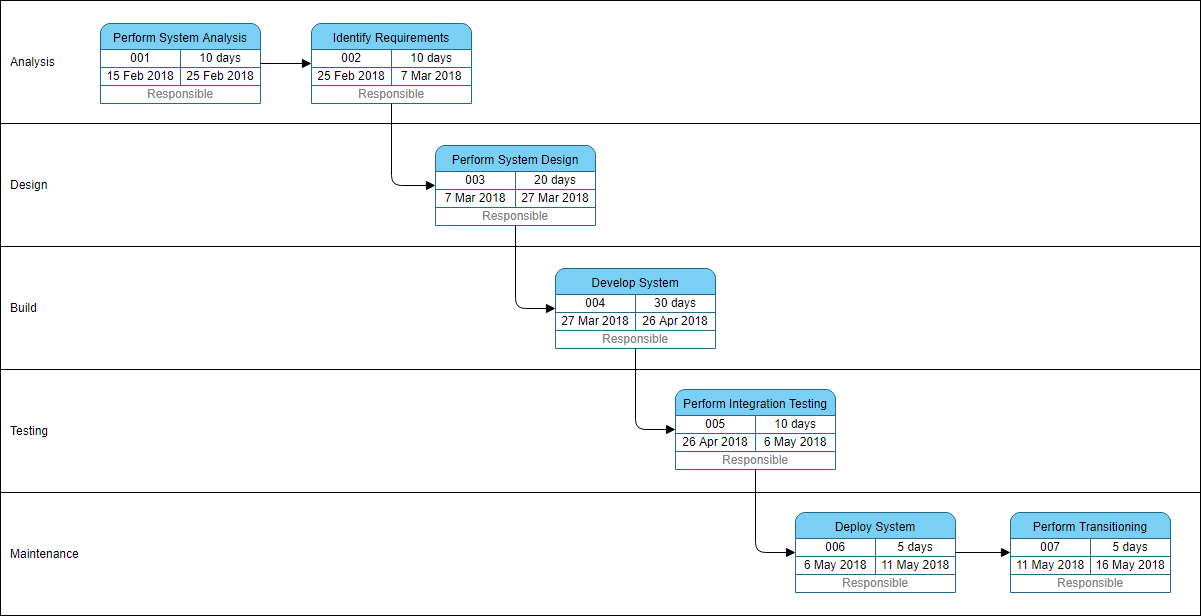
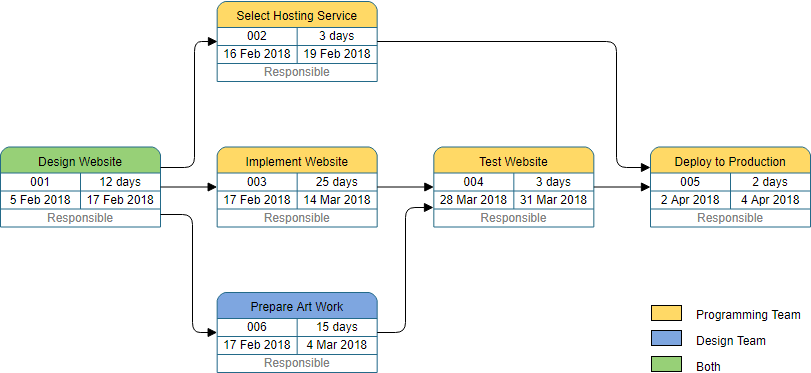
Website Creation Example – The following PERT Chart example below shows:
The PERT Chart shows the tasks involved in the process of creating a website, which includes, select hosting services, design websites, writing HTML, artwork design, and etc.
The Basic PERT Calculation
The objective of the PERT calculations is to estimate an elapsed duration from start to end of an activity or project and establish the probability of achieving that end date. To achieve this, three durations are estimated for each activity in the network; they are:
- Optimistic time – generally the shortest time in which the activity can be completed. It is common practice to specify an optimistic time to be three standards deviations from the mean so that there is approximately a 1% chance that the activity will be completed within an optimistic time.
- Most likely time – the completion time having the highest probability. Note that this time is different from the expected time.
- Pessimistic time – the longest time that an activity might require. Three standard deviations from the mean are commonly used for the pessimistic time.
Note That:
PERT assumes a beta probability distribution for the time estimates. For a beta distribution, the expected time for each activity can be approximated using the following weighted average: n
- Expected time = ( Optimistic + 4 x Most likely + Pessimistic ) / 6
- This expected time may be displayed on the network diagram.
- To calculate the variance for each activity completion time, if three standard deviation times were selected for the optimistic and pessimistic times, then there are six standard deviations between them, so the variance is given by:
[ ( Pessimistic – Optimistic ) / 6 ]
Determine the critical path – The critical path is determined by adding the times for the activities in each sequence and determining the longest path in the project. The critical path determines the total calendar time required for the project. If activities outside the critical path speed up or slow down (within limits), the total project time does not change. The amount of time that a non – critical path activity can be delayed without the project is referred to as slack time.
If the critical path is not immediately obvious, it may be helpful to determine the following four quantities for each activity:
- ES – Earliest Start time
- EF – Earliest Finish time
- LS – Latest Start time
- LF – Latest Finish time