The businesses now are becoming more vulnerable and competitive, requiring them to be more vigilant on their choice of investment which gives maximum results. The GE McKinsey matrix ensures the company to analyze its investment portfolio in a more systematic and precise manner.
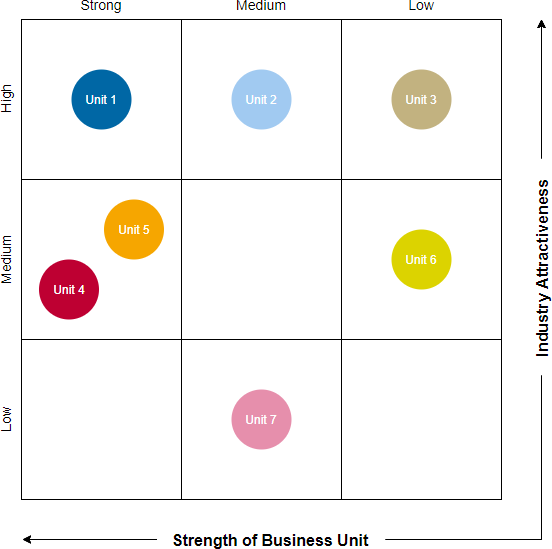
“The GE-McKinsey nine-box matrix is a strategy tool that offers a systematic approach for the multi-business corporation to prioritize its investments among its business units.”
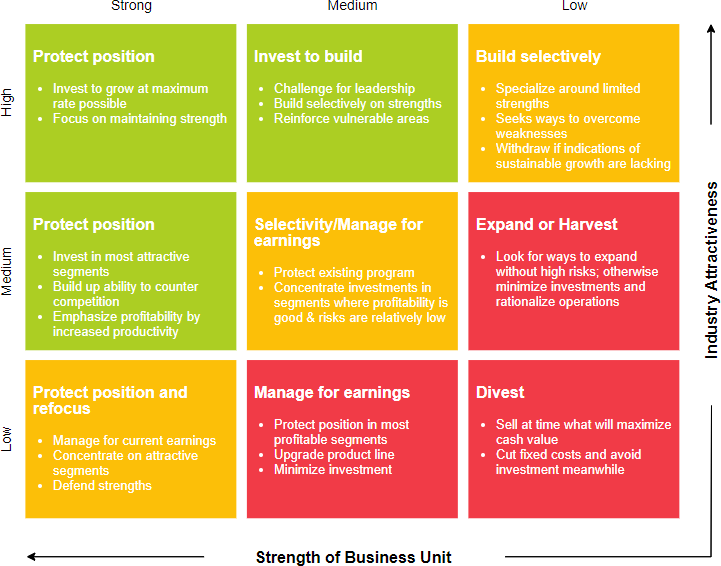
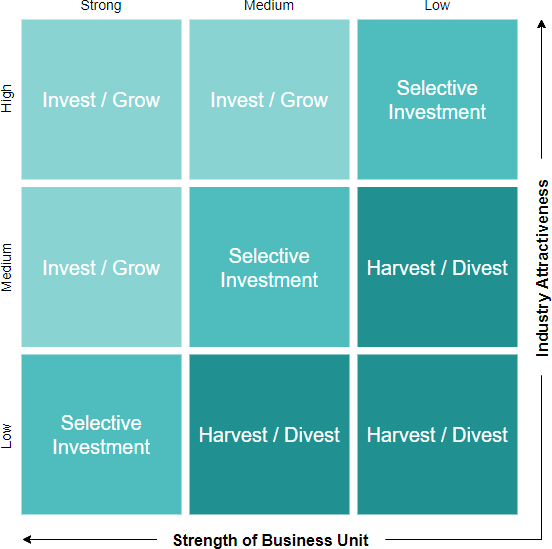
The GE matrix helps corporations to evaluate their business portfolios and prioritize investments among their diversified units in a systematic manner. It consists of nine cells that map the strategic business units of the firm. It builds on two dimensions such as industry attractiveness and business competitive strength with different drivers. For example:
Drivers of Industry Attractiveness:
- Market size
- Market growth share
- Competitive rivalry
- Demand variability
Drivers of Competitive Strength:
- Assets and competencies
- Market share
- Customer loyalty
- Cost structure
- Cash flow
Edit this GE McKinsey Matrix template
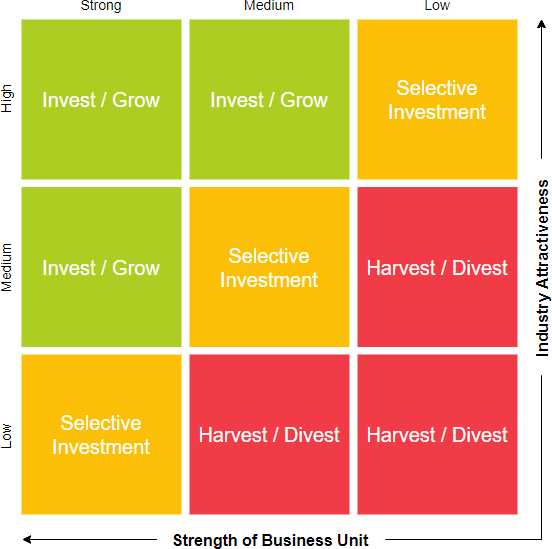
The strategic implications for managers when using this matrix are:
- Growth strategy: If the business unit is strong and it competes in an attractive industry.
- Hold strategy: If the business unit is average and it competes in an average industry.
- Harvest strategy: if the business unit is weak and it competes in an unattractive industry.
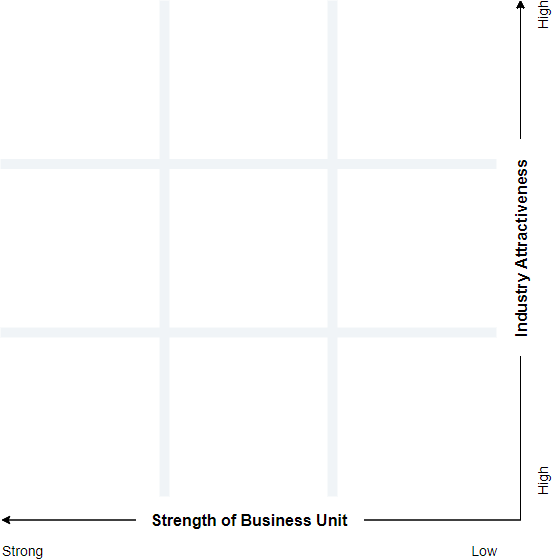
GE McKinsey Matrix with Brief Instructions
Edit this GE McKinsey Matrix template
GE McKinsey Matrix vs BCG Matrix
The GE/McKinsey matrix is divided into a 3×3 grid (see below) to provide a more fine-grained view of the strategic position of a business unit or product than the simple 2×2 BCG matrix.
The BCG matrix uses growth as a measure of market attractiveness and market share as a measure of business strength or competitiveness.
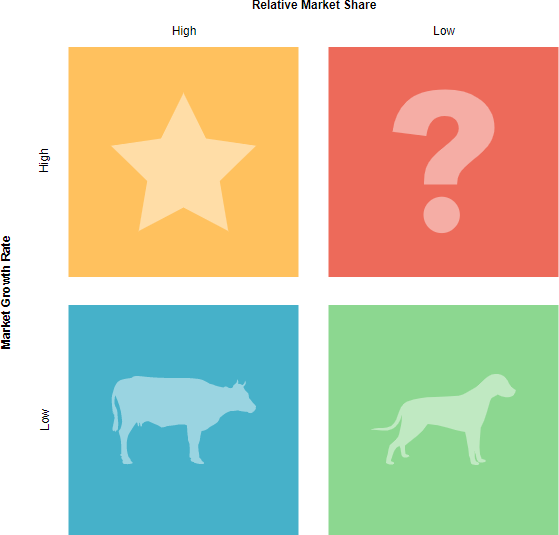
The GE/McKinsey matrix uses multiple criteria to determine these values. This provides a more realistic measure than the simplistic measures used by the BCG matrix.
Edit this GE/McKinsey matrix template
Unlike the BCG Matrix that aims to cross 4 quadrants with the “Market Participation” and “Market Growth” axes, the GE / McKinsey Matrix evaluates the “Competitive Strength” and “Market Attractiveness” axes generating the cross of 9 quadrants according to 3 intensities for each axis: Low, Medium or High.
More GE McKinsey Matrix Templates
9-Box GE McKinsey Grid Template
Edit this 9-Box GE McKinsey grid template
GE McKinsey Matrix Template with Text Template
Edit this GE McKinsey Matrix template
9-box GE McKinsey Matrix Template