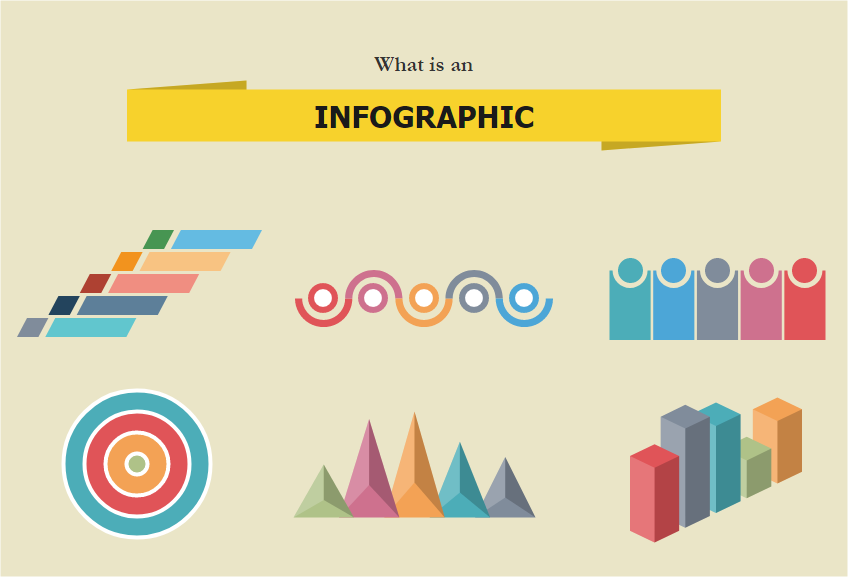
Infographics (a clipped compound of “information” and “graphics”) are graphic visual representations of information, data or knowledge intended to present information quickly and clearly. – Wikipedia
Infographics are a powerful tool for displaying data, explaining concepts, simplifying presentations, mapping relationships, showing trends and providing essential insights.
Usage of Infographics
Infographics can improve cognition by utilizing graphics to enhance the human visual system’s ability to see patterns and trends. Similar pursuits are information visualization, data visualization, statistical graphics, information design, or information architecture.
- Show the best and worst values in a data set
- Demonstrate changes and trends over time
- Break down the subject item to illustrate its various components
- Illustrate the distribution of data?
- Shed light on the relationship between various values
Why Infographics?
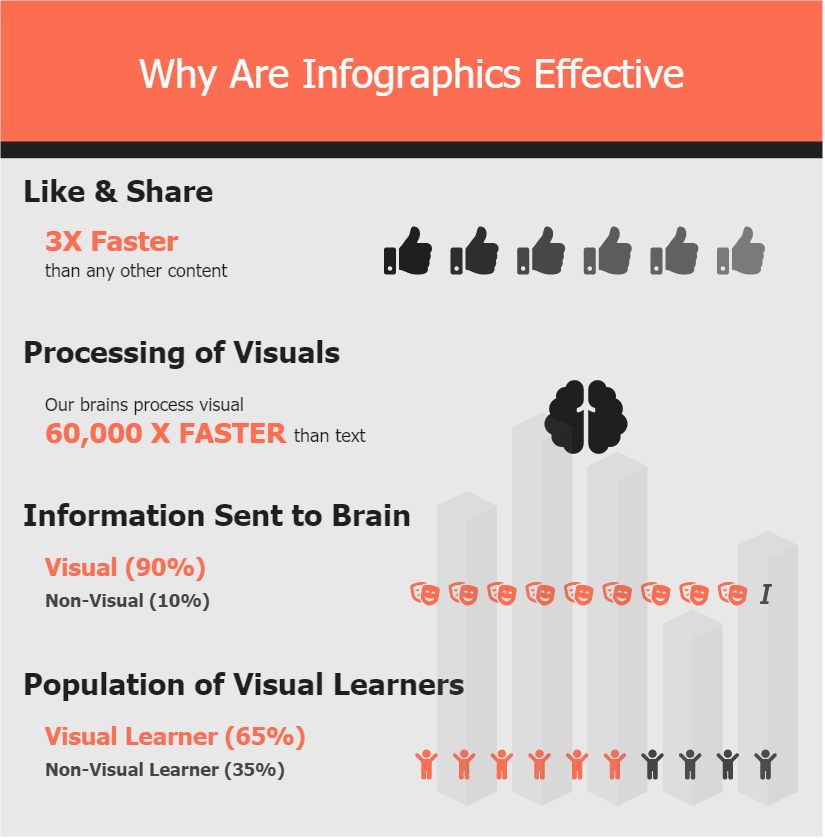
Infographics are perfect for compiling a lot of data into one easy-to-follow format that’s both nice to look at and persuasive. Search volumes for infographics have increased significantly, Not only are infographics visually appealing and fun to look at, but they’re also an extremely effective SEO and marketing tool.
The average attention span of a human is eight seconds, and therefore marketers need to make a meaningful impact immediately to connect with their target audiences. Our brains do less work to digest visual content, first of all. And, more compellingly for marketers, visual content drives more traffic and engagement than plain text does.
There are countless of benefits for using infographics for our day-to-day life and here listed below just only a few of them:
- Minimal text with high impact
- It simplifies complex concepts or ideas.
- Easily shareable on Social networks
- Simple to create unique content that aligns with your brand
- Increases knowledge retention.
- Engages distracted corporate learners
- Eye-catching for enhancing SEO
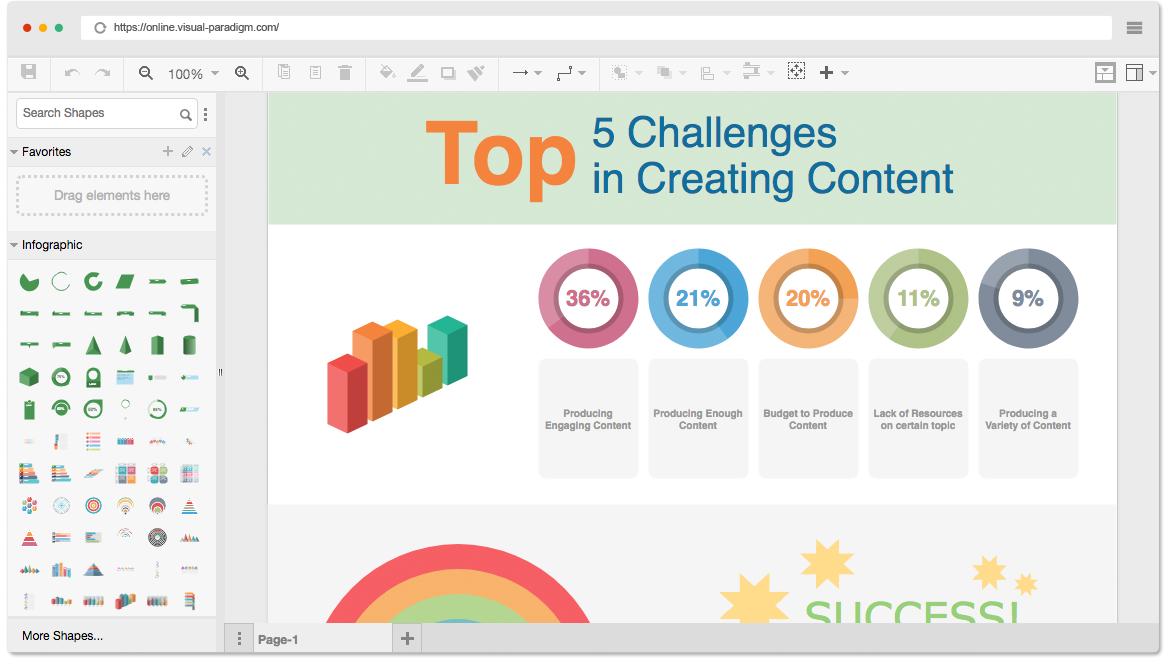
Visual Paradigm Infographics Designer
Although infographics appear to be graphically complicated and expertly made, you can easily make them yourself and save a lot of money by using Visual Paradigm Online. You will find many more resources for making your infographics such as templates, examples, diagrams, charts and related resources available on the site for easily create professional infographics with incredibly low subscription fees!