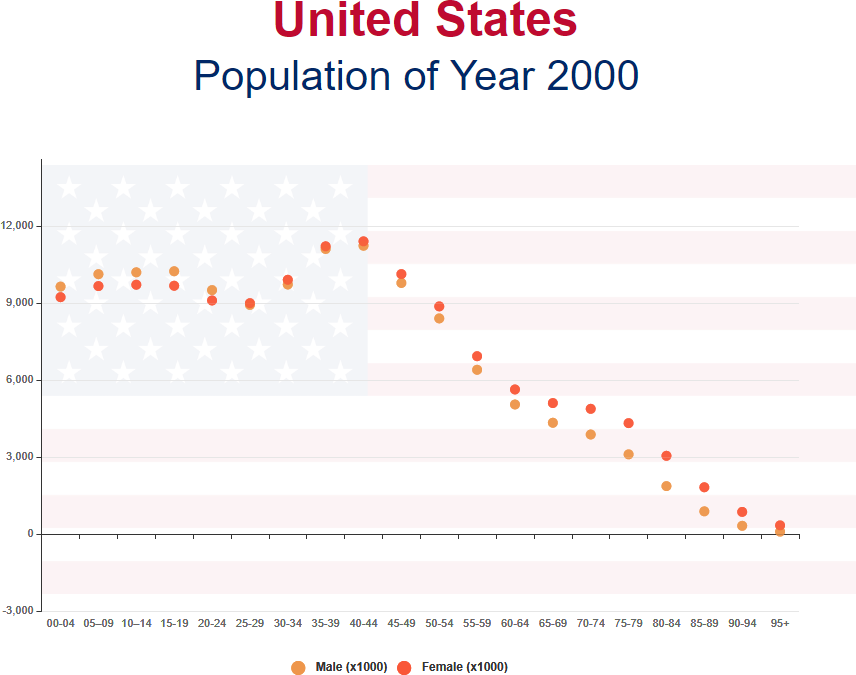
A Scatter Chart (also called a scatter plot, scatter graph, or scatter diagram) is a type of plot or mathematical diagram using Cartesian coordinates to display values for typically two variables for a set of data. The data are displayed as a collection of points, each having the value of one variable determining the position on the horizontal axis and the value of the other variable determining the position on the vertical axis. If the points are coded with color, shape or size, one additional variable can be displayed, it is often called a bubble chart.
When to Use Scatter Chart?
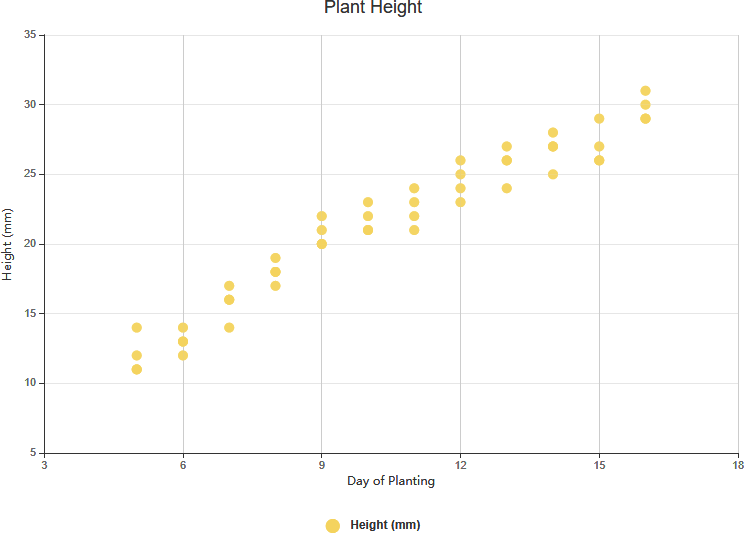
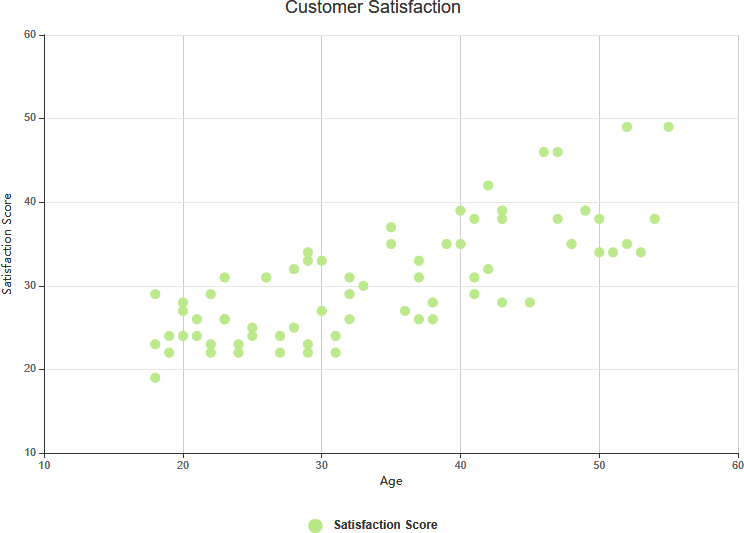
Scatter charts are useful to show the correlation of variables and to visualize clusters of data points. The points exhibit a pattern that would not be revealed otherwise. People use scatter for the following cases:
- Scatter Diagrams are easy to draw.
- It can be easily understood and interpreted
- Shows the correlation between two variables
- Observation and reading of the pattern and trend are straightforward.
Scatter Chart Templates
Edit this Scatter Chart template