Perceptual maps (also known as product positioning maps) have been used by marketers for years to better understand a market landscape and know how customers view your products versus the competition. It is a visual expression of consumers’ perception and preference for a certain series of products or brands. It is especially used in the positioning of products, product series, and brands, and also used to describe the relative position of enterprises and competitors. Firms use perceptual maps to help them develop a market positioning strategy for their product or service.
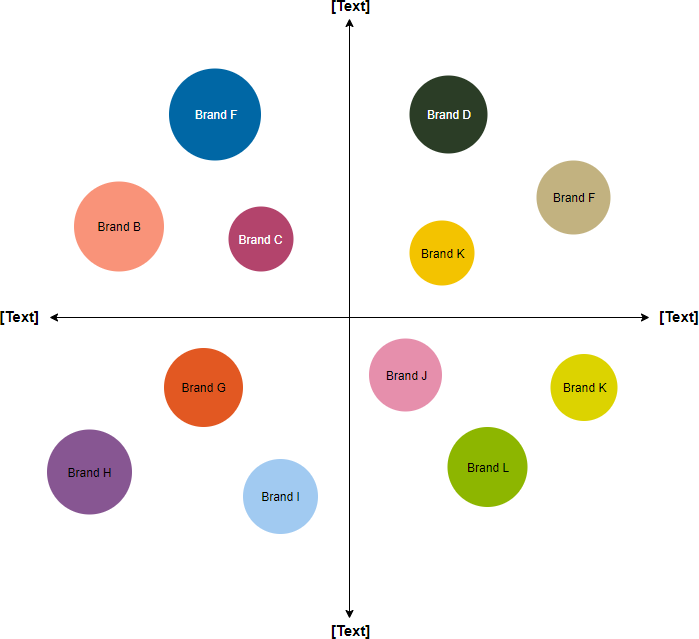
Typically, a perceptual map has 2 lines: the x and y-axis. The x-axis goes left to right and the y-axis goes bottom to top. Any criteria can be used for the map for example price, quality, status, features, safety, and reliability. Once the two lines have been drawn and labeled existing products will be placed onto the map. Below is an example of a perceptual map template: