Value Stream Mapping (VSM) is a fundamental tool to identify waste, reduce process waste. It is an essential lean tool for an organization wanting to plan, implement, and improve while on its lean journey. VSM helps users create a solid implementation plan that will maximize their available resources and help ensure that materials and time are used efficiently. Value Stream Analysis is a powerful planning tool to optimize the result of eliminating waste.
But what is a waste anyway?
Waste can come in the form of time, material, and labor. But it may also be related to the utilization of skill-sets as well as poor planning. VSM helps to optimize process steps and eliminating waste, the only true value is added at each phase of production.
“The elements of an activity that do not add value from the customer perspective”
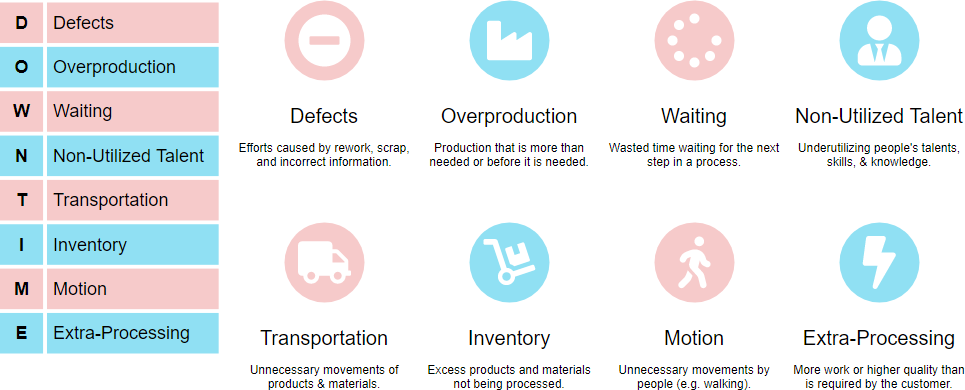
Seven forms of originally conceived when the Toyota Production System was first conceived and an eighth added when the lean methodology was adopted within the Western World. In there, 7 / 8 wastes are production process-oriented, while the eighth waste is directly related to management’s ability to utilize personnel.
A trick to memorize them more easily is the acronym “DOWNTIME”:
Value Stream Mapping Analysis
VSM is a special type of flow chart that uses symbols known as “the language of Lean” to depict and improve the flow of inventory and related information. It combines two powerful tools into one.
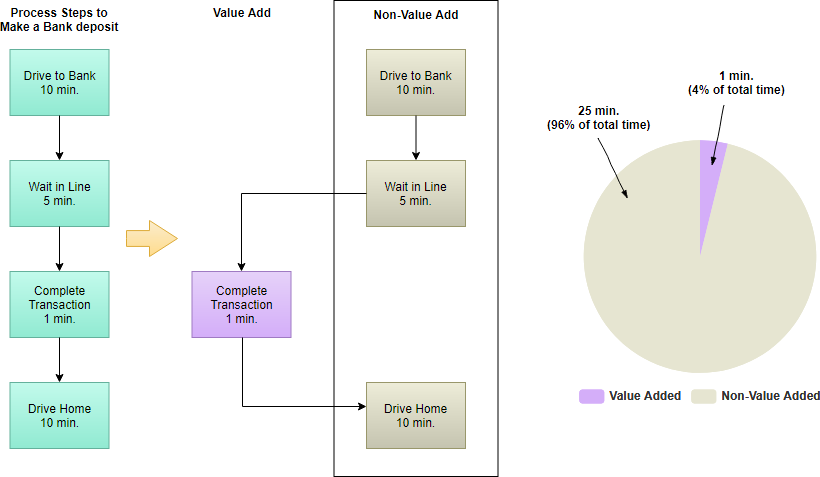
- The Value Analysis differentiates steps that add value in the eyes of the customer from those that do not
- Flow Analysis calculates the time spent on each step.
This makes clear the time and effort being spent on non-value adding activities, the cost of doing business, and sets the stage for reducing waste and streamlining the process. The purpose of value stream mapping is to maximize value and minimize waste in several different ways including:
- Facilitating clear communication and collaboration
- Encouraging continuous improvement of a process
- Enabling culture change within an organization
- Creating visualizations of delays, excess inventory and production constraints
Value Added, Non-Value Added, Necessary Nonvalue Added Activities
Value-added activities are those processes that must be completed to satisfy your customer base. For example:
“There’s no way I’ll buy that unless you include…”
Nonvalue-added activities are production or service-related activities that simply add cost to, or increase time spent on, a product service without increasing its market value (i.e. 8 classic wastes). For example, the repair of machines, storage of inventory, moving materials, maintenance, and inspections
Necessary non-value adding activities don’t contribute to customer satisfaction that they must be done and they are essential and difficult to remove from the operation or production, i.e. comply with regulations or organizational policies, etc.
Note That:
Nonvalue-added activities consume resources but create no value for the customer. Even if they stopped and they would be invisible to the end-user or customer.
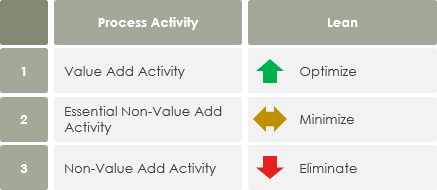
In conclusion, value-added activities should be further optimized for seeking continuous improvement and growth of an organization, while the non-value added activities should be eliminated, or at least minimized as much as possible.
Value and Non-Value Added Example – Deposit Money in ATM
Components of Value Stream Mapping
| Symbols | Description |
|---|---|
 |
Customer/Supplier: represents the Supplier when in the upper left, the customer when in the upper right, the usual endpoint for material |
 |
Dedicated Process Flow: a process, operation, machine or department, through which material flows. It represents one department with a continuous, internal fixed flow. |
 |
Shared Process: a process, operation, department or 11 Shared Process: a process, operation, or department that other value stream families share. |
 |
Data Box: it contains significant information/data required for analyzing and observing the system. |
 |
Work Cell: indicates that multiple processes are integrated into a manufacturing work Cell. |
| Inventory: show inventory between two processes | |
| Shipments: represents the movement of raw materials from suppliers to the Receiving dock/s of the factory. Or, the movement of finished goods from the Shipping dock/s of the factory to the customers | |
| Push Arrow: represents the “pushing” of material from one process to the next process. | |
 |
Supermarket: an inventory “supermarket”. |
 |
Material Pull: supermarkets connect to downstream processes with this “Pull” that indicates physical removal. |
| FIFO Lane: First-In-First-Out inventory. Use It when processes are connected with a FIFO system that limits input. | |
 |
Safety Stock: represents an inventory “hedge” (or safety stock) against problems such as downtime, to protect the system against sudden fluctuations in customer orders or system failures. |
 |
External Shipment: shipments from suppliers or to customers using external transport |
 |
Production Control: this box represents a central production scheduling or control department, person or operation. |
| Manual Info: a straight, thin arrow shows the general flow of information from memos, reports, or conversation. Frequency and other notes may be relevant. | |
| Electronic Info: this wiggle arrow represents electronic flow 14 such as electronic data interchange (EDI), the Internet, Intranets, LANs (local area network), WANs (wide area network). You may indicate the frequency of information/data interchange, the type of media used ex. fax, phone, etc. and the type of data exchanged. | |
 |
Production Kanban: it triggers the production of a predefined number of parts. It signals a supplying process to provide parts to a downstream process. |
 |
Withdrawn Kanban: it represents a card or device that instructs a material handler to transfer parts from a supermarket to the receiving process. The material handler (or operator) goes to the supermarket and withdraws the necessary items. |
 |
Signal Kanban: used whenever the on-hand inventory levels in the supermarket between two processes drop to a trigger or minimum point. It is also referred to as “one-per-batch” Kanban. |
| Kanban Post: a location where Kanban signals reside for pickup. Often used with two-card systems to exchange withdrawal and production Kanban. | |
 |
Sequence Pull: represents a pull system that gives instruction 15 to subassembly processes to produce a predetermined type and quantity of product, typically one unit, without using a supermarket. |
| Load Leveling: a tool to batch Kanban to level the production volume and mix over some time. | |
| Go See Production: the gathering of information through visual means | |
 |
Verbal Information: represents verbal or personal information flow |
 |
Kaizen: used to highlight improvement needs and plan kaizen workshops at specific processes that are critical to achieving the Future State Map of the value stream. |
 |
Operator: represents an operator. It shows the number of operators required to process the VSM family at a particular workstation. |
 |
Other Information: other useful or potentially useful information. |
| Timeline: shows value-added times (Cycle Times) and nonvalue added (wait) times. Use this to calculate Lead Time and Total Cycle Time. |
Value Stream Map Terminology
- C/T (Cycle Time): processor cycle time = time to complete a task.
- P/T or C/O (Changeover Time): The non-value added time required to convert a line from one product to another changeover time or setup time to begin a new task.
- VA (Value Added Task): value-added time or the time needed to complete a required task.
- NVA (None Value Added Task): non-value-added time = PT – VAT.
- L/T (Lead Time): lead time, or the total time from when a task is started within a work center until it leaves the work center.
- FTT (First Time Through): First time quality or first time through quality yield.
- T/T (Takt Time): The average unit production time needed to meet customer demand.
- Capacity: A metric that indicates how many parts per day your slowest process can handle.
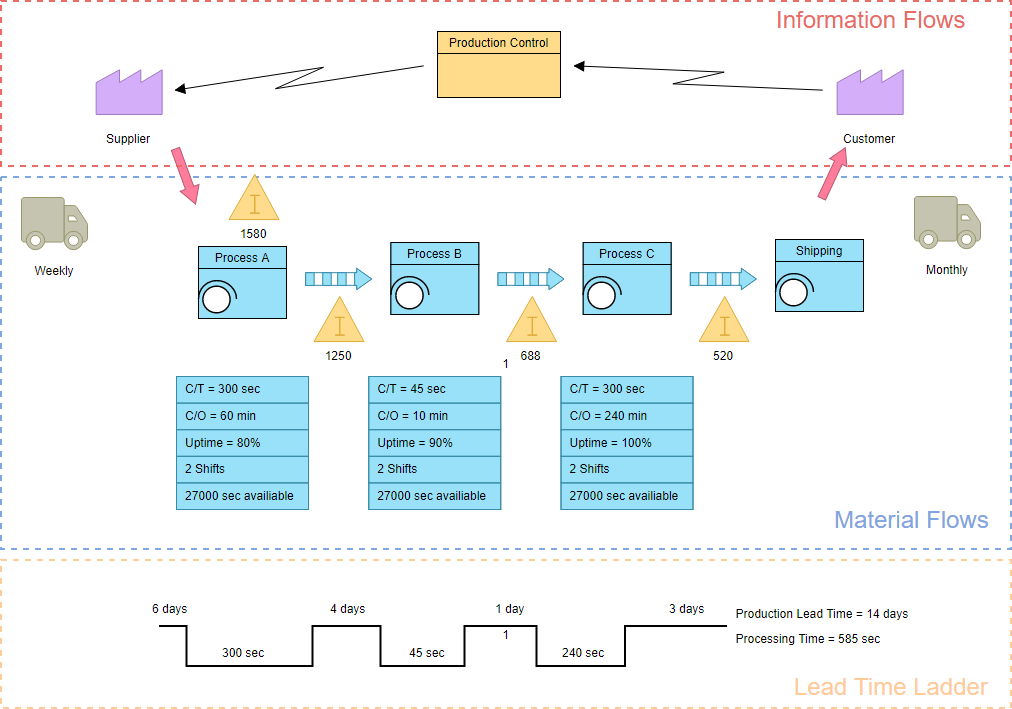
Value Stream Mapping Example
Value stream maps can be created with flowchart software by following the steps below:
- The first step in value stream mapping is drawing of the PROCESS BOXES for the different process steps, starting from the supplier side going up to the customer side in the information flows area.
- The Second Step draw the different types of process boxes for different kind of production steps under the information flow section called Material flows.
- The third step in value stream mapping is DATABOXES just under each of the process (or production steps), in which data is captured of each of the process steps drawn in the map. Information that might be interesting for VSM design can be put here.
- The fourth step is to draw the CONNECTION METHODS between the process boxes.
- Step fifth step describes linking CUSTOMERS AND SUPPLIERS to the process.
- Step five is the LEAD TIME LADDER on the bottom of the VSM, which shows different aspects of time in the value stream.
The example below shows what a typical value stream map might look like: