Causal loops diagrams (also known as system thinking diagrams) are used to display the behavior of cause and effect from a system’s standpoint. Fishbone diagrams may elicit the categories of causes that impact a problem. Causal loops show the interrelation causes and their effects. When finished you have a diagram of the positive and negative reinforcements which describe the system of behavior. The neat thing about causal loops is it is depersonalizing. People can point at the arrows in the loop that are reinforcing the problem instead of pointing at people. It becomes a model of system behaviors that create the outcome of the system.
A causal loop diagram (CLD) is a causal diagram that aids in visualizing how different variables in a system are interrelated. The diagram consists of a set of nodes and edges. Nodes represent the variables and edges are the links that represent a connection or a relation between the two variables. A link marked positive indicates a positive relationship and a link marked negative indicates a negative relation. A positive causal link means the two nodes change in the same direction, i.e. if the node in which the link starts decreases, the other node also decreases. Similarly, if the node in which the link starts increases, the other node increases as well. A negative causal link means the two nodes change in opposite directions, i.e. if the node in which the link starts increases, the other node decreases, and vice versa.
Cause Loop Diagram Example – Growth and Investment
A Growth and Underinvestment structure is simply an elaborated Limits to Growth structure where the growth inhibitor is part of another Balancing Loop with an external standard and some delay. The nasty thing about this structure is that the two balancing loops form a single reinforcing loop that inhibits growth.
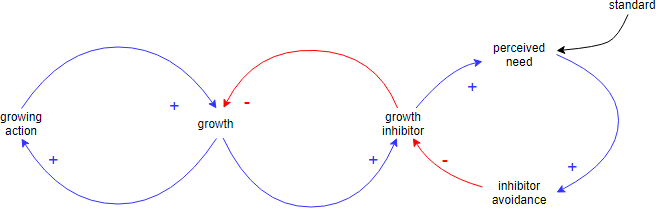
- The growing action which initiates this structure influences an increase in growth. The resultant growth then simply influences more of the same growing action, producing the reinforcing growth characteristic.
- As was indicated in the Balancing Loop areas of concern, noting growth forever. Growth sooner or latter produces some effect which tends to limit the growth. As growth moves in the desired direction, it also influences an increase in some growth inhibitor. This growth inhibitor subsequently impedes growth.
- This system can be enabled to grow more if the growth inhibitor is reduced. As the growth inhibitor interacts with a defined standard it develops a perceived need for action to develop some sort of inhibitor avoidance. This inhibitor avoidance will, after some delay, reduce the growth inhibitor. The annoying part of this structure is the delay associated with the inhibitor avoidance interaction with the growth inhibitor.
- What happens is that the growth inhibitor works in a shorter time frame reducing growth. The reduced growth adds less to the growth inhibitor thus eliminating the perceived need. As such the system is limited in its growth because the perceived need for action is undermined by the systems own actions. By the time it is realized that inhibitor avoidance action needs to be taken the need to dissolves itself and growth levels off at a level much lower than what could have been achieved.
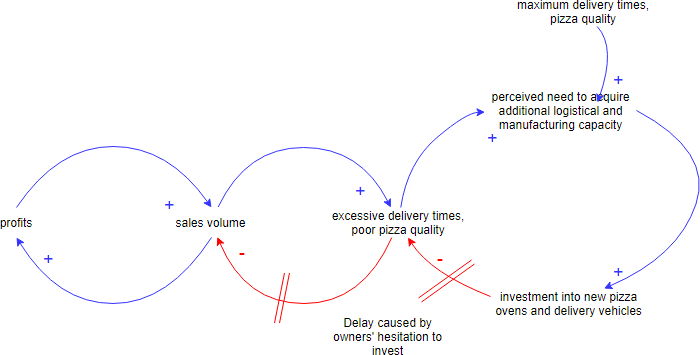
Cause Loop Diagram Example – Pizza House
A new home delivery-focused pizzeria opens up in the neighborhood. At first, the demand is low, but the pizza’s quality is excellent, as well as the delivery times. After a while, the pizzeria gets noticed and is featured in a local online food blog. As a result, the demand for pizza rises sharply. But the pizzeria owners are reluctant to purchase more delivery capacity (pizza delivery vehicles and personnel) along with higher pizza production capacity (additional pizza ovens). That results in higher delivery times and a larger percentage of undercooked pizzas, in turn lowering the number of returning customers. As a result, the pressure for additional investment in both delivery and production capacity is eliminated. The pizzeria owners are happy that they held off on the additional investment.