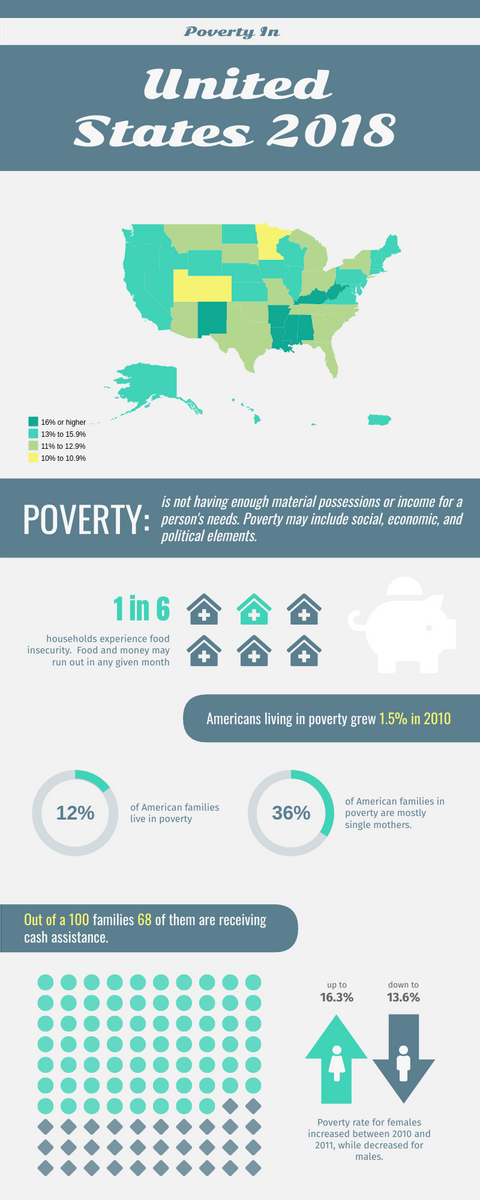
Infographic Of 2018 Poverty Rate in the United States
You may consider that US is the richest country in the world does not have a poverty myth. In fact, the United States has one of the highest poverty rates among developed countries.
OECD report ranked the United States 29 of 31 OECD countries in 2012. When it comes to child poverty, things are even worse.
A UNICEF report found that the United States ranked 34 of 35 developed countries – only Romania had a higher child poverty rate.
According to the ProvertyUSA.org:
Poverty does not hit all demographics equally. For example, in 2018, 10.6 per cent of men and 12.9 per cent of women were living in Poverty USA. Similarly, the poverty rate for married couples in 2018 was just 4.7 per cent-but the poverty rate for single-parent families without a wife was 12.7 per cent and for single-parent families without a husband was 24.9 per cent.
The poverty rate for people living with disabilities was 25.7% in 2018. That's about 4 million
people living with disabilities—in poverty.
Want to put all these information in to simple, informative report in a single page? Try Visual Paradigm Infographics for FREE!
People love fast easy-to-access information and infographics offer just that kind of visual representation typically in one single page. Even abstract data is easier to comprehend
when paired with figure, charts, or images.
Choose a pre-made template for your visual presentation
Insert your own data to the corresponding components
To customize the theme of template, i.e. change colors, fonts and icons
Upload your own graphics or images if necessary
Publish or print your poster
