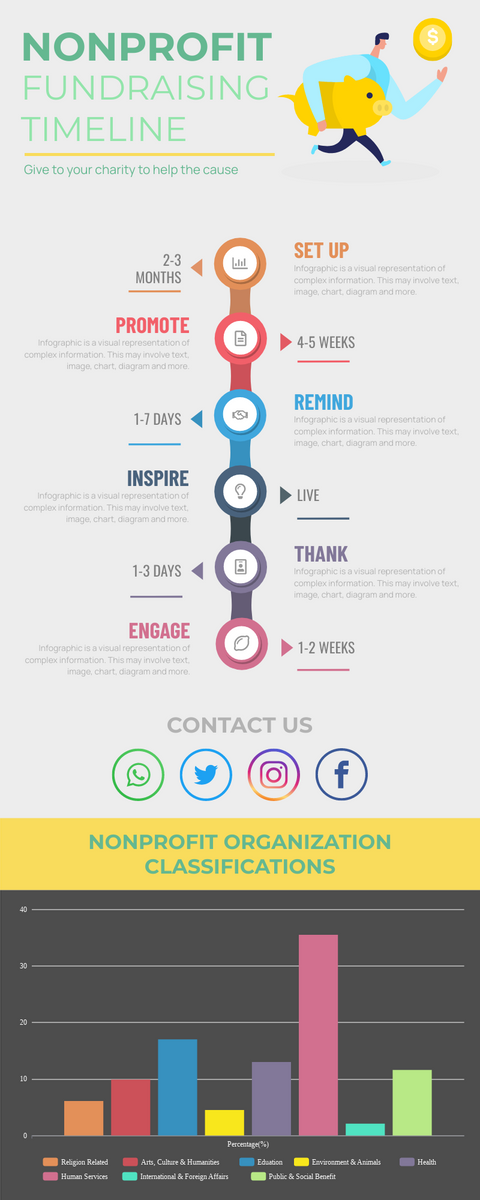
Infographic Of Nonprofit Fundraising Timeline
"It’s really clear that the most precious resource we all have is time." - Steve Jobs
What is a Timeline?
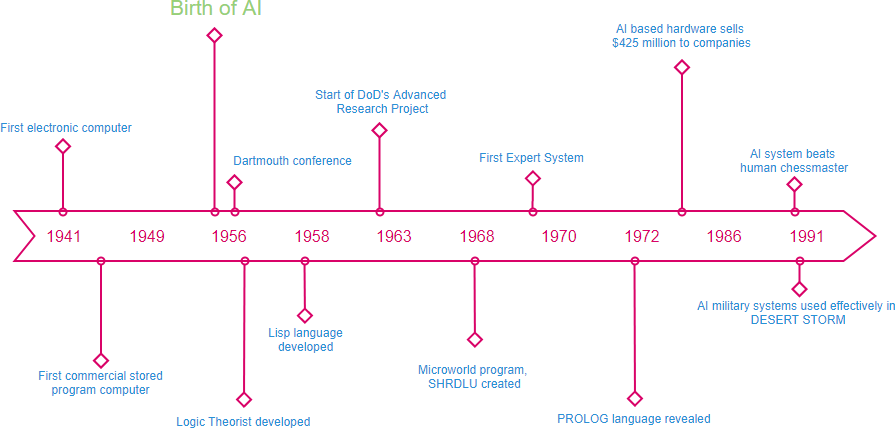
A timeline is a way to graphically display a series of events in chronological order. Some timetables are even drawn in proportion to the length of time, while others simply show the events in order. It helps you better understand history, a story, a process or any other form of an event sequence arranged in chronological order and displayed along a line (usually drawn left to right or top to bottom).
The main function of a timeline is to convey information about time in order to analyze or present historical stories.
If the timeline is drawn to scale, we can look at the time interval between different events to get a sense of when the event occurred or is about to happen, and find out if the events in that time period follow any pattern, or if and how the event is distributed over that time period.
Sometimes timeline diagrams are combined with graphs to show quantitative data changes over time and increasingly, timelines are illustrated in infographics combining text and graphic images for a better presentation.
A timeline is useful to document for any type of development, providing an easy-to-understand history and helping viewers to understand past and ongoing quickly. explains what happened during a certain period or to a particular event (topics or concept, a person and etc.), starting with the earliest event and moving forward through time.