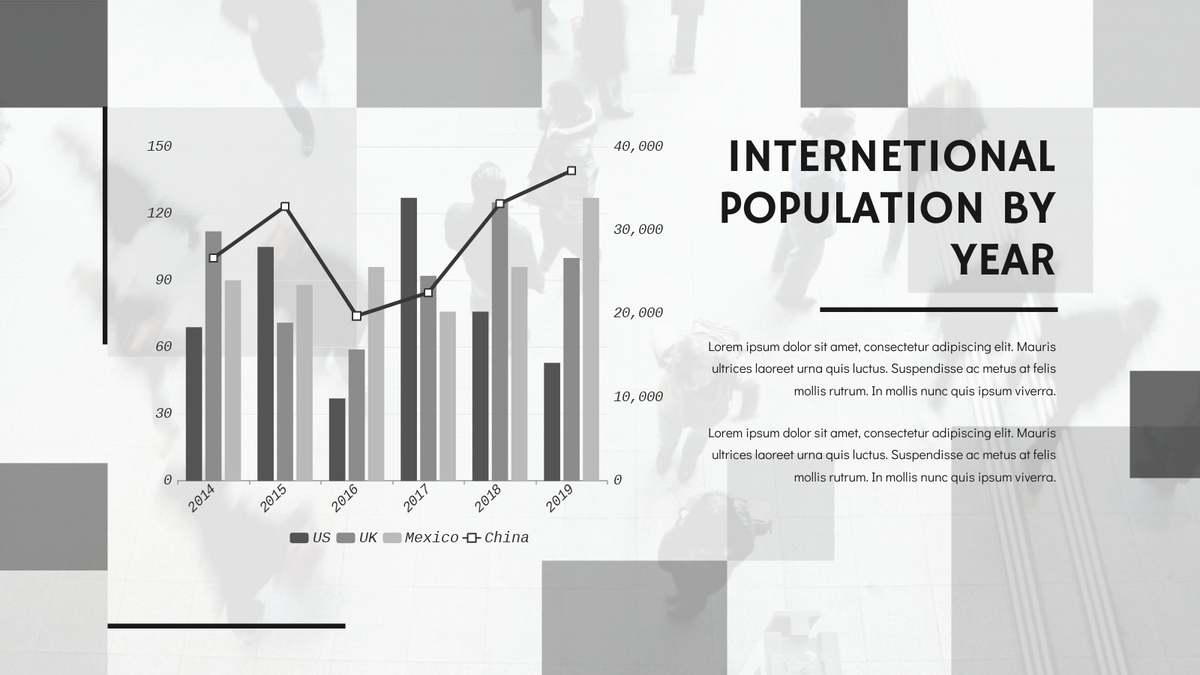
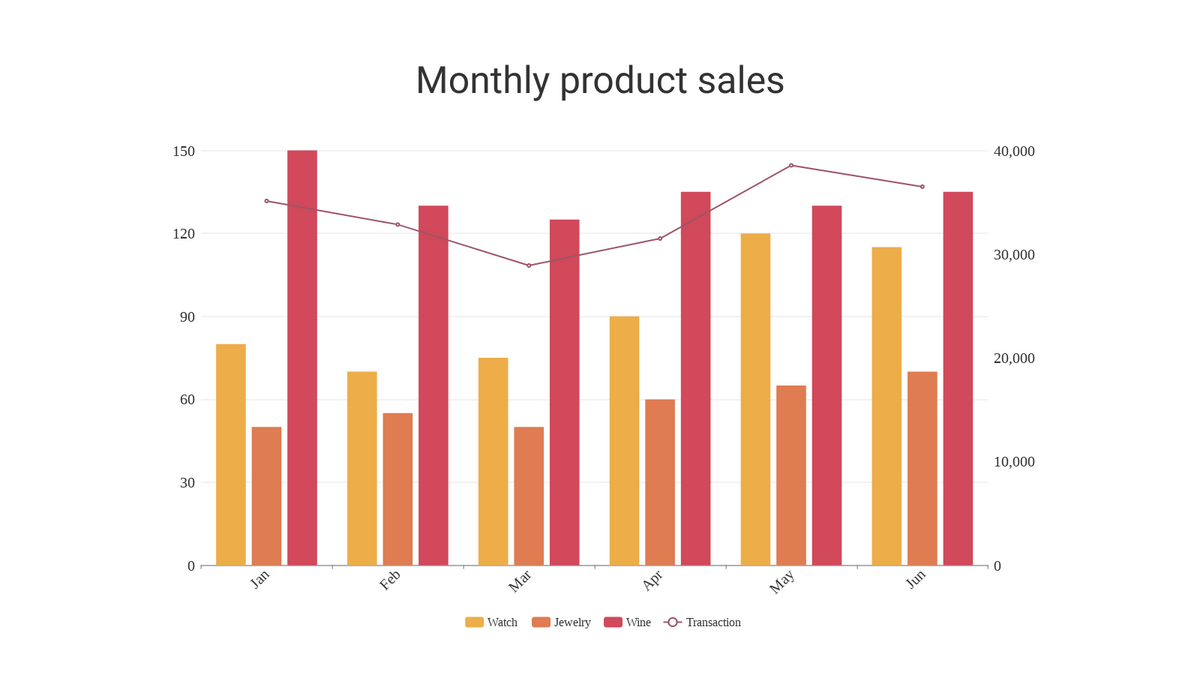
Create grouped column and line charts on Visual Paradigm to show your data visually. Visual Paradigm Online offers everything you need to make a stunning grouped column and line chart online. Feel free to choose from grouped column and line chart templates, replace your own data and make minor adjustment to the design to fit your need. No professional skills needed. Let's have a try now!
Grouped Column and Line Charts Template Specifications:
Customizable:
Engage your audience with Visual Paradigm's online grouped column and line chart template like this one. Adjust all aspects of this template to accommodate your preferences. Replace your own data via our spreadsheet editor. Touch-up the design by changing the background, color and font. With our useful chart creator, it's never been simpler to create amazing grouped column and line charts.
Dominant Color
Palette
Dimension
1600 x 900 px


