A data-flow diagram (DFD) is a way of representing a flow of data of a process or a system that aims to be accessible to a computer specialist and non-specialist users alike. The DFD also provides information about the outputs and inputs of each entity and the process itself. A data-flow diagram has no control flow, there are no decision rules and no loops. Specific operations based on the data can be represented by a flowchart.
The models enable software engineers, customers and users to work together effectively during the analysis and specification of requirements. Although this means that our customers are required to understand the modeling techniques and constructs, in data-flow modeling only a limited set of constructs are used, and the rules applied are designed to be simple and easy to follow.
The benefits of data-flow diagrams
Data-flow diagrams provide a very important tool for software engineering, for several reasons:
- The system scope and boundaries are indicated on the diagrams (more will be described the boundaries of systems and each DFD later in this chapter).
- The technique of decomposition of high-level data-flow diagrams to a set of more detailed diagrams provides an overall view of the complete system, as well as a more detailed breakdown and description of individual activities, where this is appropriate, for clarification and understanding.
The Elements of DFD
The DFD notation was first described in 1979 by Tom DeMarco as part of Structured Analysis. There are several other widely-used DFD notations which include the following table:
- Yourdon and/or De Marco,
- Yourdon and Coad,
- Gane & Sarson,
- SSADM(Structured System Analysis and Design Methodology), and
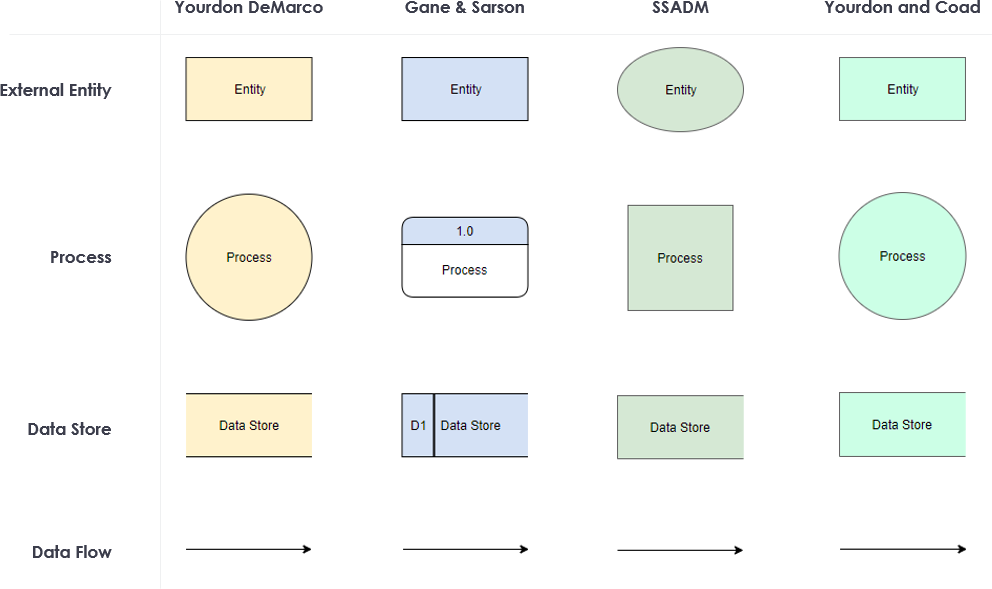
Processes are the essential activities, carried out within the system boundary, that use information. A process is represented in the model only where the information which provides the input into the activity is manipulated or transformed in some way so that the data flowing out of the process is changed compared to that which flowed in.
Data-flow represents a package of information flowing between two objects in the data-flow diagram. Data-flows are used to model the flow of information into the system, out of the system, and between elements within the system.
Data store is a place where data is stored and retrieved within the system. This may be a
External entities are entities outside of the system boundary which interact with the system, in that they send information into the system or receive information from it. External entities may be external to the whole organization — as in Customer and Supplier in our running example; or just external to the application area where users’ activities are not directly supported by the system under investigation. Accounts and Engineering are shown as external entities as they are recipients of information from the system. Sales also provide input to the system.
External entities are often referred to as sources and sinks. All information represented within the system is sourced initially from an external entity. Data can leave the system only via an external entity.
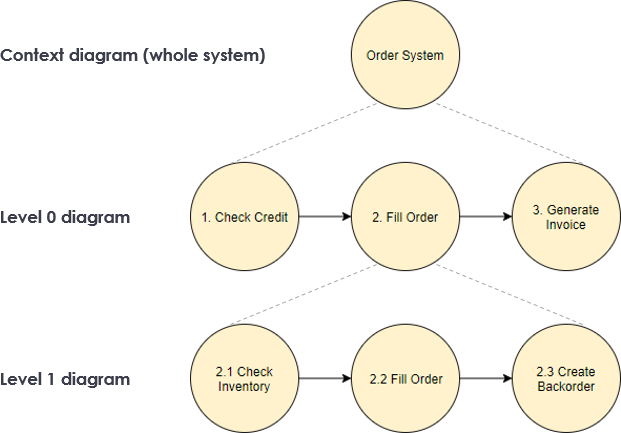
DFD Leveling with the Top-down Decomposition Technique
In DFD, the top-down decomposition, also called leveling, is a technique used to show more detail in lower-level DFDs. Leveling is done by drawing a series of increasingly detailed diagrams until the desired degree of detail is reached. As shown in the Figure, DFD Leveling is first displaying the targeted system as a single process, and then showing more detail until all processes are functional primitives.
- DFDs that are at a higher level are less detailed
- High-level DFDs are to be decomposed into more detailed DFDs at lower levels
- The Context Diagram is the highest in the hierarchy (see DFD Creation Rules). The so-called zero level is followed by DFD 0, starting with process numbering (e.g., process 1, process 2).
- In the next, the so-called first level – DFD 1 – the numbering continues. E.g. process 1 is divided into the first three levels of the DFD, which are numbered 1.1, 1.2 and 1.3.
- Similarly, processes in the second level (DFD 2) are numbered e.g. 1.1.1, 1.1.2, 1.1.3 and 1.1.4.
- The number of levels depends on the size of the model system. Each of the processes in level 0 may not have the same number of decomposition levels.
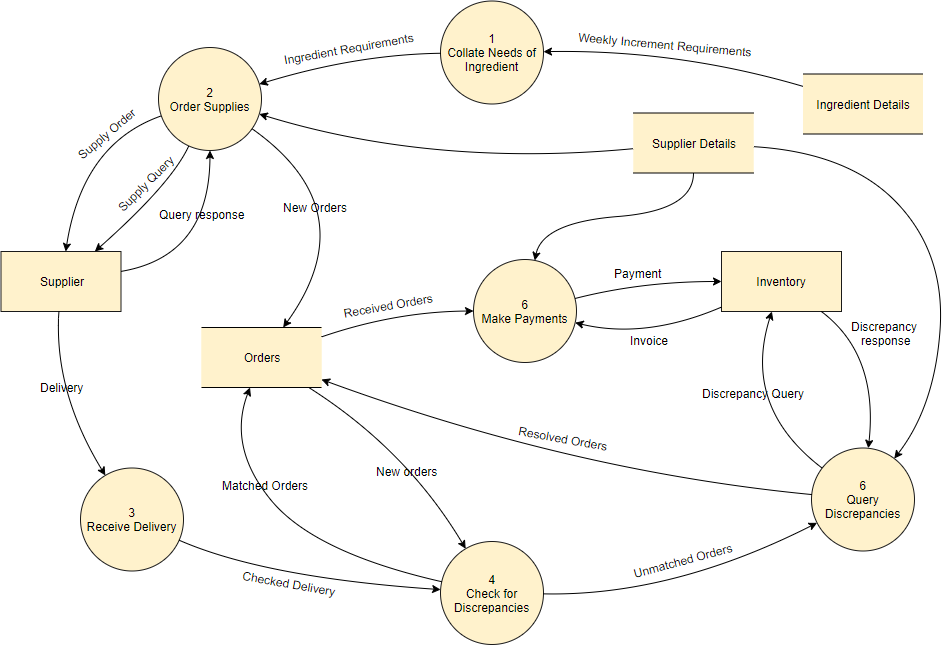
Data-flow Diagram Example – Online Shop
The Online Shop example is given below. It just a part of the online shop system, do not worry about which parts this diagram is describing. This example just tries to illustrate the notation of a data-flow diagram.
Edit this DFD (Yourdon and DeMarco Example
As can be seen, the DFD notation consists of only four main symbols:
Processes — the activities carried out by the system which uses and transform information. Processes are notated as circles with six parts, such as “Order Supplies” and “Make Payments” in the above example.
Data-flows — the data inputs to and outputs from these activities. Data-flows are notated as named arrows, such as “Delivery” and “Supply Order” in the example above.
External entities — the sources from which information flows into the system and the recipients of information leaving the system. External entities are notated as rectangles, such as “Supplier” in the example above.
Data stores — where information is stored within the system. Data stores are notated as open-ended rectangles with two parts, such as “Supplier Details” and “Orders” in the example above.
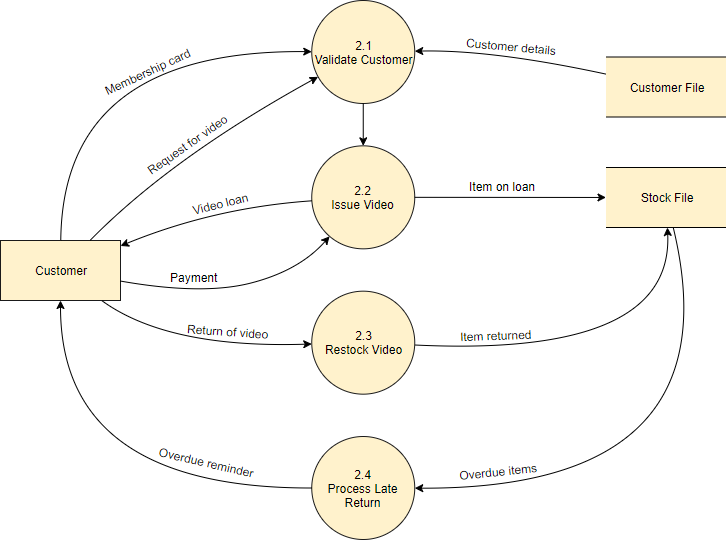
Data Flow Diagram Example: Video Rental Shop
Context Diagram Example
The context diagram is used to establish the context and boundaries of the system to be modeled: which things are inside and outside of the system being modeled, and what is the relationship of the system with these external entities.
A context diagram is drawn to define and clarify the boundaries of the software system. It identifies the flows of information between the system and external entities. The entire software system is shown as a single process.
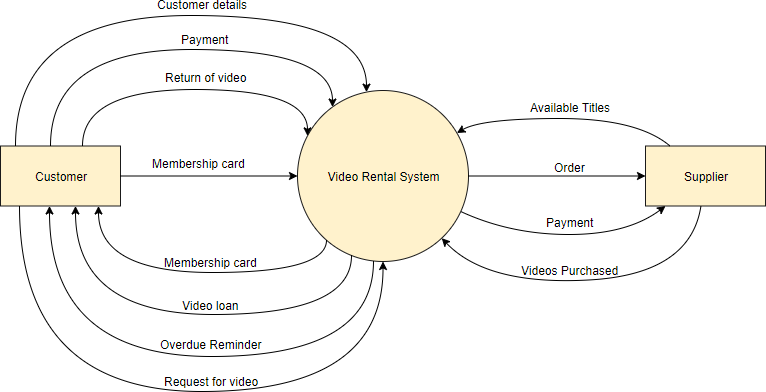
Edit this Yourdon and DeMarco Example
Top-Level DFD (also known as Level 0 DFD)
As described previously, context diagrams are diagrams where the whole system is represented as a single process. A level 0 DFD notates each of the main sub-processes that together form the complete system. We can think of a level 0 DFD as an “exploded view” of the context diagram.
The level 0 DFD for the Video Rental Shop is given as follows:
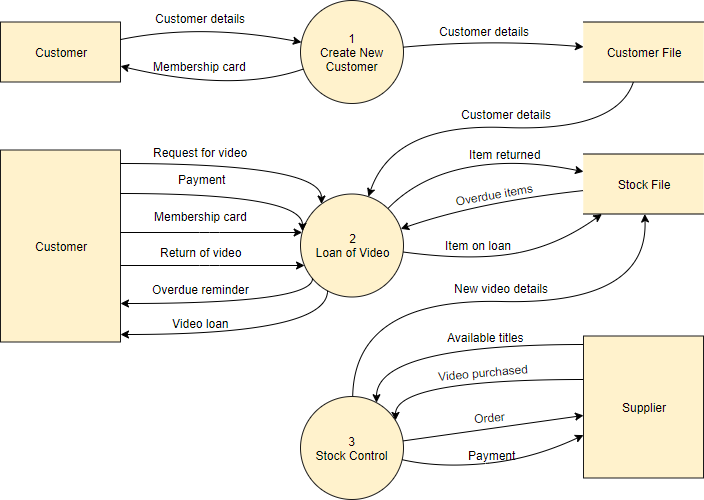
Edit this Yourdon and DeMarco DFD Example
It is important to notice that the same data-flows to and from the external entities appear on this level 0 diagram and the context diagram. Each time a process is expanded to a lower level, the lower level diagram must show all the same data-flows into, and out of the higher-level process it expands.
Decomposing Top-Level DFD into a lower hierarchy
We have already seen how a context diagram can be decomposed into a level 0 DFD. This same process can be applied to each process appearing within a level 0 DFD. A sub-level DFD that represents a decomposed level 0 DFD process is called a level 1 DFD. There can be a level 1 DFD for each process that appears in the level 0 DFD.
Example Level 1 DFD
A possible level 1 DFD for process “2: Loan of video” of the level 0 DFD is as follows: