


Latest Articles
All-in-One Fast Growing and Frequently Updated Knowledge Base for FREE!
Learn practical tutorials and articles here, and apply what you have learned straight-away with step-by-step examples and templates online.
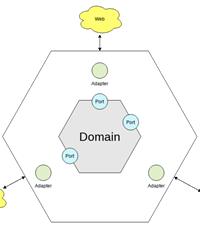
What is Hexagonal Architecture Diagram
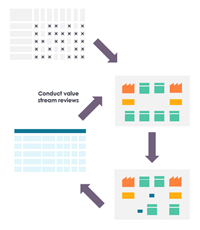
How to Use VSM in Six Sigma
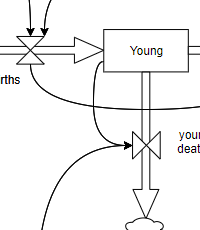
What is Stock and Flow Diagram?
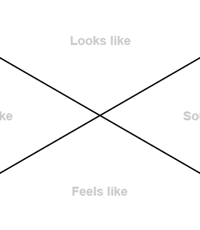
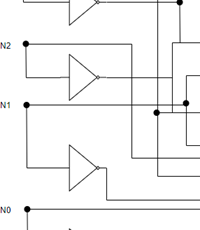
Thinking Skill: What is X Chart?
Thinking Skill: What is a T-Chart?
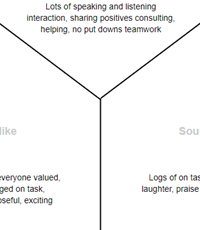
Critical Thinking: What is Y-Chart?