Waste can come in the form of time, material, and labor. But it may also be related to the utilization of skill-sets as well as poor planning. VSM helps to optimize process steps and eliminating waste, only true value is added at each phase of production.
“The elements of an activity that do not add value from the customer perspective”
Seven form of originally conceived when the Toyota Production System was first conceived, and an eighth added when lean methodology was adopted within the Western World. In there, 7 / 8 wastes are production process oriented, while the eighth waste is directly related to management’s ability to utilize personnel.
A tricks to memorize them more easily is the acronym “DOWNTIME”:
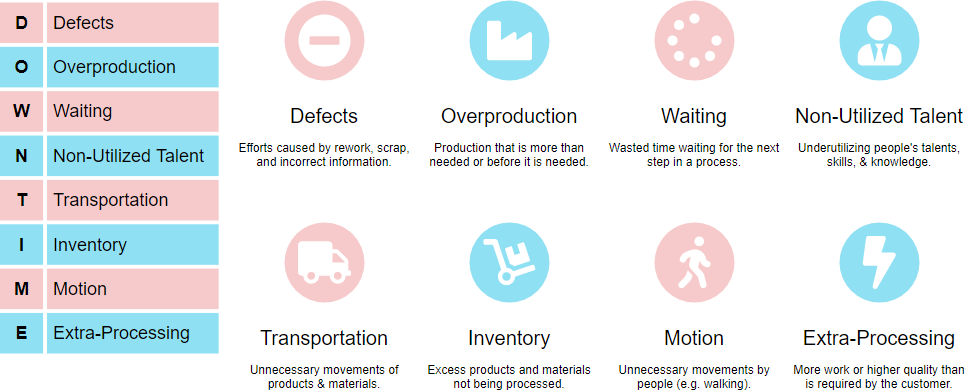
Examples of 8 Types of Wastes
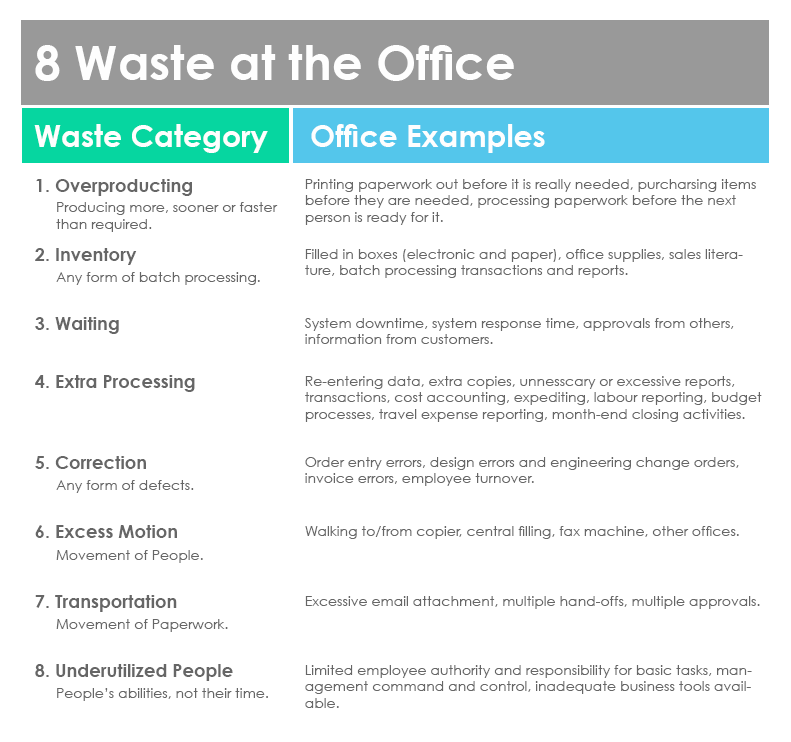
The manufacturing process is not the only area of a company that incurs waste on a regular basis. Although most of organizations in different industries also seek for continuous improvements to increase their competitiveness, many companies find abundant opportunities for waste reduction in the office. In the office environment, the 8 classic waste types of the Lean methodology manifest in different ways than we see on the factory floor. Here is a list of the 8 wastes of Lean, and some ideas about how they manifest in the office environment
Eliminating Waste with Value Stream Mapping (VSM)
Value Stream Mapping (VSM) is fundamental tool to identify waste, reduce process waste. It is an essential lean tool for an organization wanting to plan, implement, and improve while on its lean journey. VSM helps users create a solid implementation plan that will maximize their available resources and help ensure that materials and time are used efficiently. Value Stream Analysis is a powerful planning tool to optimize result of eliminating waste.
Value Stream Mapping Analysis
VSM is a special type of flow chart that uses symbols known as “the language of Lean” to depict and improve the flow of inventory and related information. It combines two powerful tools into one.
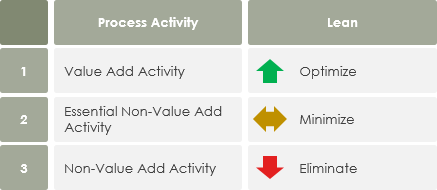
- The Value Analysis differentiates steps that add value in the eyes of the customer from those that do not
- Flow Analysis calculates the time spent on each step.
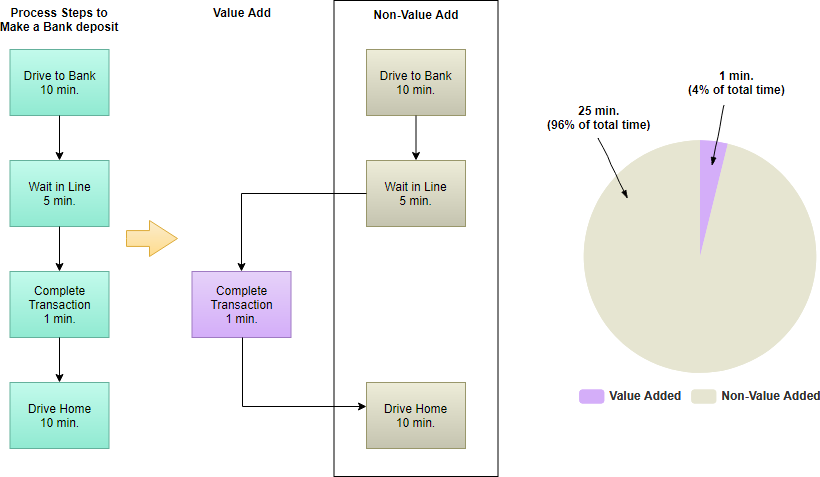
Value Added, Non-Value Added, Necessary Nonvalue Added Activities
Value and Non-Value Added Example – Deposit Money in ATM
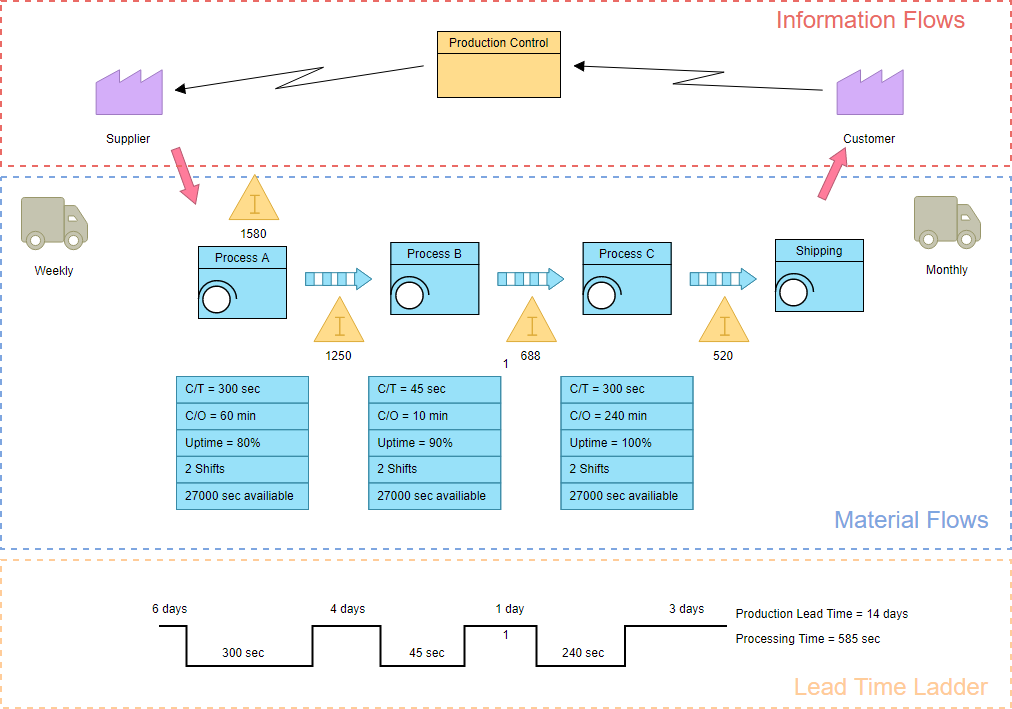
Value Stream Mapping Example
Value stream maps can be created with flowchart software by following the steps below:
- The first step in value stream mapping is drawing of the PROCESS BOXES for the different process steps, starting from the supplier side going up to the customer side in the information flows area.
- The Second Step draw the different types of process boxes for different kind of production steps under the information flow section called Material flows.
- The third step in value stream mapping is DATABOXES just under each of the process (or production steps), in which data is captured of each of the process steps drawn in the map. Information that might be interesting for VSM design can be put here.
- The forth step is to draw the CONNECTION METHODS between the process boxes.
- Step fifth step describes linking CUSTOMERS AND SUPPLIERS to the process.
Step five is the LEAD TIME LADDER on the bottom of the VSM, which shows different aspects of time in the value stream.
The example below shows what a typical value stream map might look like: