Lean thinking, suggested by James Womack, aims to provide a new way to think about how to organize human activities to deliver more benefits to society and value to individuals while eliminating waste. A lean enterprise can have much higher change to be sustained in growth by aligning customer satisfaction with employee satisfaction. They also seek for offering innovative products or services profitably while minimizing unnecessary over-costs to customers, suppliers and the environment.
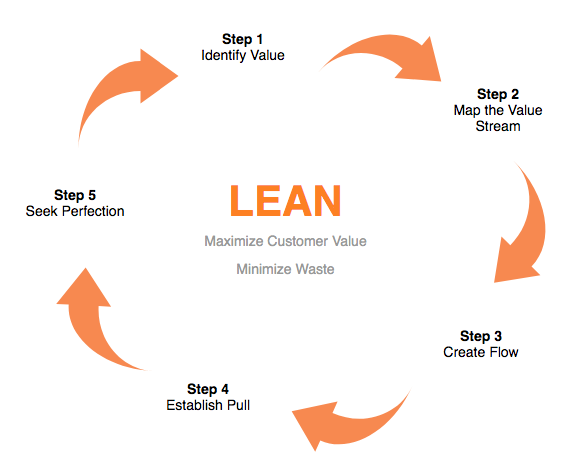
Lean thinking considers the waste bound to be inadvertently generated by the way the process is organized. The five steps for Lean Transformation is listed as following:
Identify value from the standpoint of the end customer by product family.
- Identify all the steps in the value stream for each product family, eliminating whenever possible those steps that do not create value.
- Make the value-creating steps occur in tight sequence so the product will flow smoothly toward the customer.
- As flow is introduced, let customers pull value from the next upstream activity.
- As value is specified, value streams are identified, wasted steps are removed, and flow and pull are introduced, begin the process again and continue it until a state of perfection is reached in which perfect value is created with no waste.
Mapping Value Stream and Finding Waste
The basic insight of lean thinking is that if you train every person to identify wasted time and effort in their own job and to better work together to improve processes by eliminating such waste, the resulting enterprise will deliver more value at less expense while developing every employee’s confidence, competence and ability to work with others.
Value Stream Mapping (VSM) is fundamental tool to identify waste, reduce process waste. It is an essential lean tool for an organization wanting to plan, implement, and improve while on its lean journey. VSM helps users create a solid implementation plan that will maximize their available resources and help ensure that materials and time are used efficiently. Value Stream Analysis is a powerful planning tool to optimize result of eliminating waste.
But what is a waste anyway?
Waste can come in the form of time, material, and labor. But it may also be related to the utilization of skill-sets as well as poor planning. VSM helps to optimize process steps and eliminating waste, only true value is added at each phase of production.
“The elements of an activity that do not add value from the customer perspective”
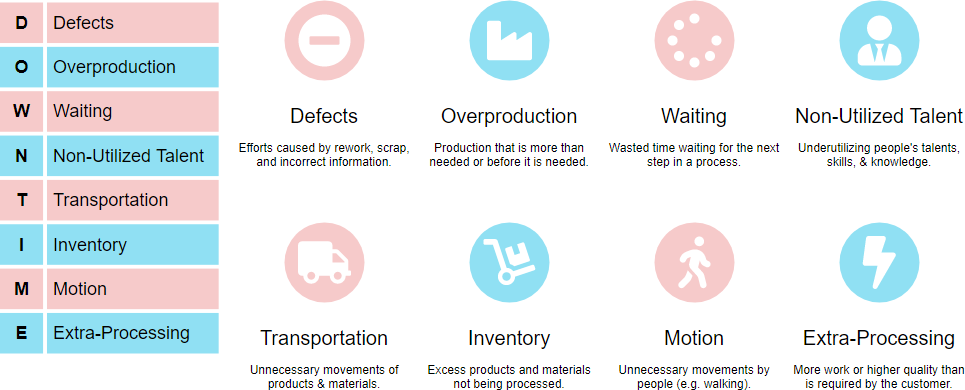
Seven form of originally conceived when the Toyota Production System was first conceived, and an eighth added when lean methodology was adopted within the Western World. In there, 7 / 8 wastes are production process oriented, while the eighth waste is directly related to management’s ability to utilize personnel.
A tricks to memorize them more easily is the acronym “DOWNTIME”:
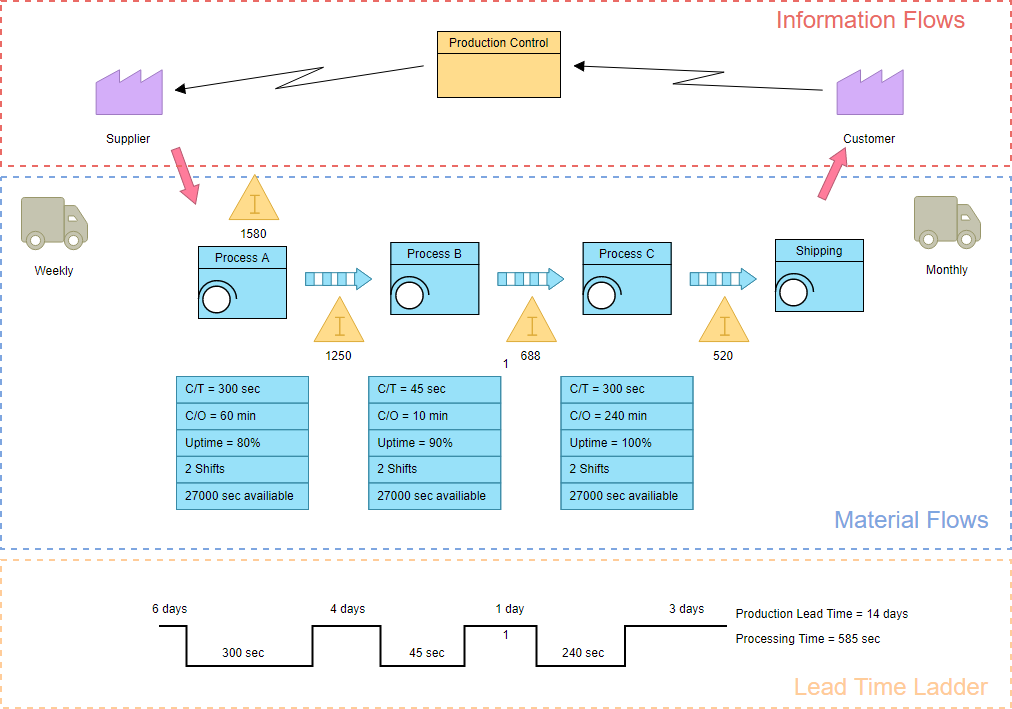
Value Stream Mapping
VSM is a special type of flow chart that uses symbols known as “the language of Lean” to depict and improve the flow of inventory and related information. It combines two powerful tools into one.
- The Value Analysis differentiates steps that add value in the eyes of the customer from those that do not
- Flow Analysis calculates the time spent on each step.
This makes clear the time and effort being spent on non-value adding activities, the cost of doing business, and sets the stage for reducing waste and streamlining the process.
Value stream maps can be created with flowchart software by following the steps below:
- The first step in value stream mapping is drawing of the PROCESS BOXES for the different process steps, starting from the supplier side going up to the customer side in the information flows area.
- The Second Step draw the different types of process boxes for different kind of production steps under the information flow section called Material flows.
- The third step in value stream mapping is DATABOXES just under each of the process (or production steps), in which data is captured of each of the process steps drawn in the map. Information that might be interesting for VSM design can be put here.
- The forth step is to draw the CONNECTION METHODS between the process boxes.
- Step fifth step describes linking CUSTOMERS AND SUPPLIERS to the process.
Step five is the LEAD TIME LADDER on the bottom of the VSM, which shows different aspects of time in the value stream. The example below shows what a typical value stream map might look like: